Sets and Venn Diagrams
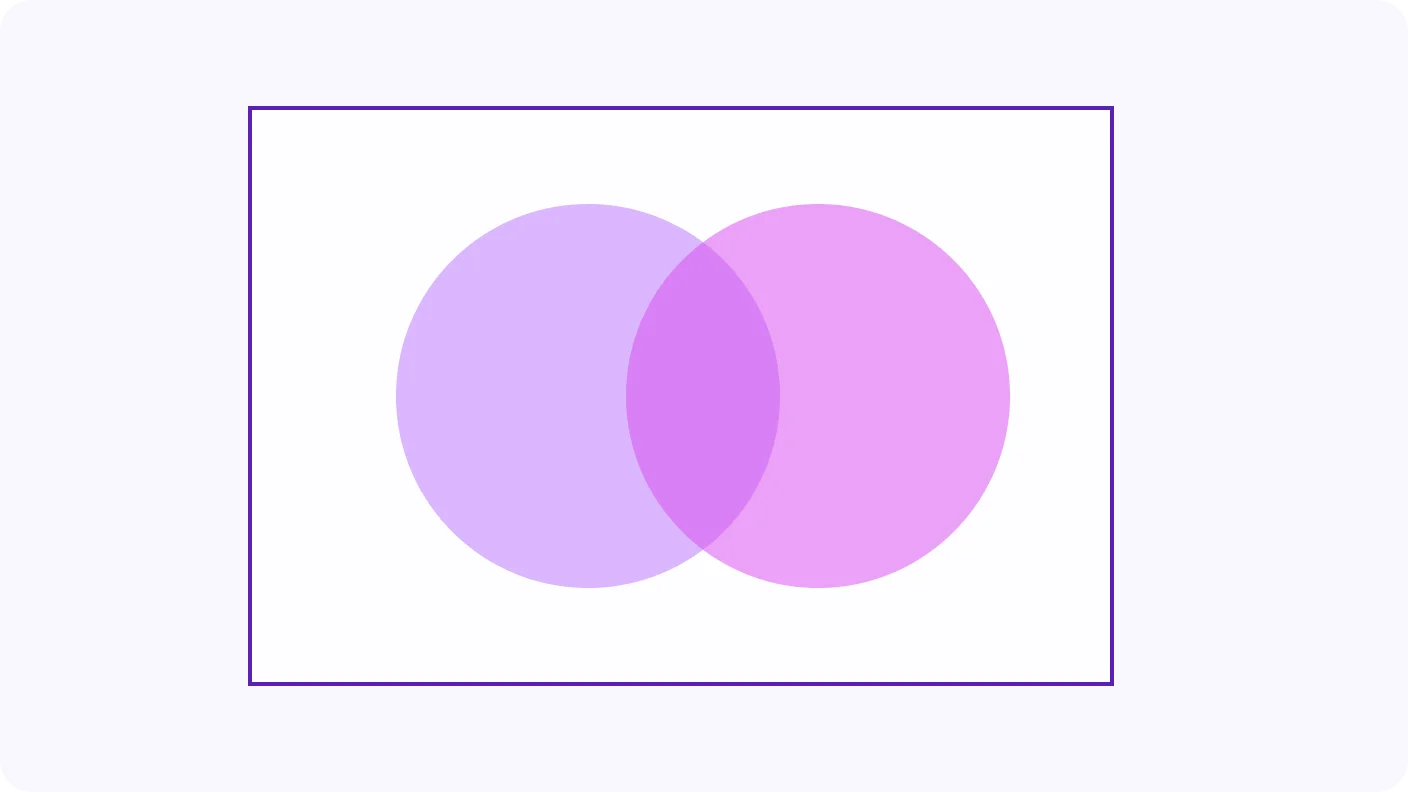
A Venn diagram uses overlapping circles to show how sets are related. Draw circles for football and tennis players: the overlap is the intersection (∩), the players who do both (AND). Everything inside either circle is the union (∪), all who play a sport (OR).
Video Lesson
Watch and learn the basics
🎬 Did this video explain it clearly?
Flashcards
Review key concepts visually
%20Sets%20in%20Maths.webp)
%20Venn%20Diagram%20(Notation).webp)
%20Venn%20Diagram%20(Example).webp)
%20Venn%20Diagram%20(Practice).webp)
What Is a Set?
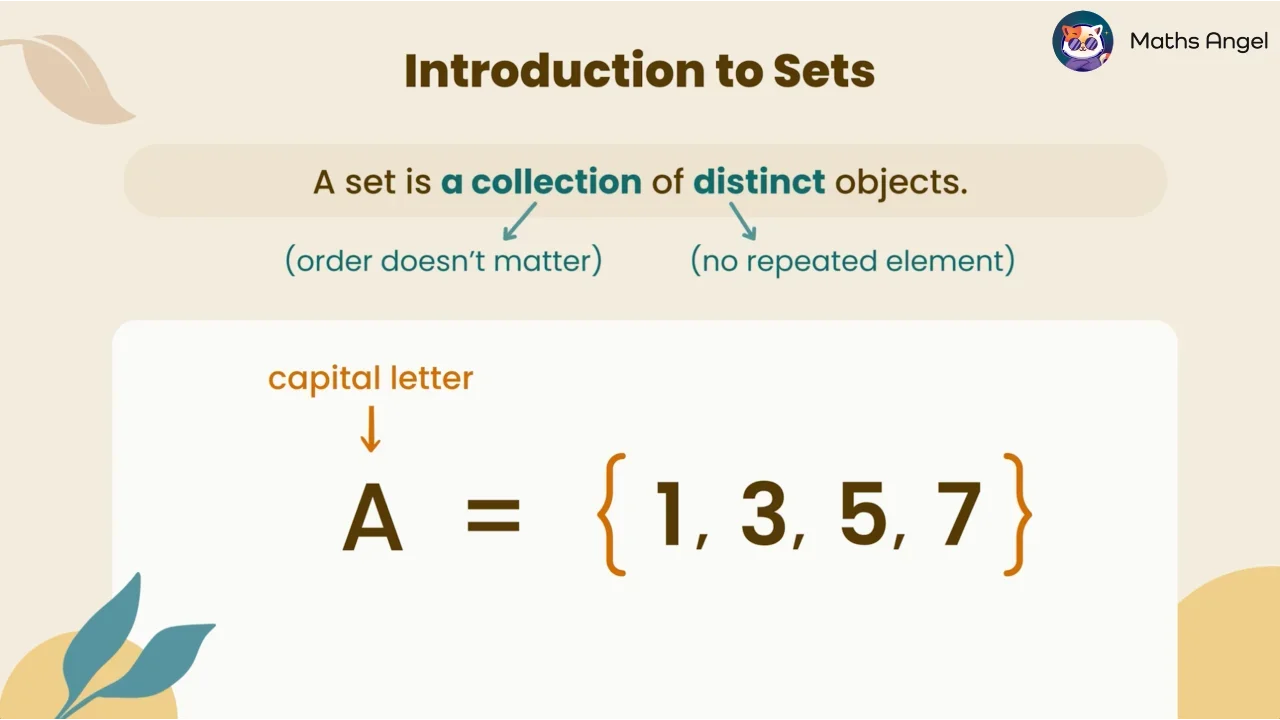
- A set is a collection of distinct objects.
- The order does not matter and there are no repeated elements.
Understanding Venn Diagrams
- A Venn diagram is a visual representation of sets and their relationships.
- The universal set shows everything being considered.
Intersection and Union
- The intersection (∩) means AND, so it is what is in set A and set B at the same time.
- The union (∪) means OR, so it is what is in set A or set B or both.
Reading Numbers from a Venn Diagram
- Add all regions to find the total number in the universal set.
- Not B means elements outside set B. To find it, subtract set B from the universal set.
Practice Questions
Test your understanding
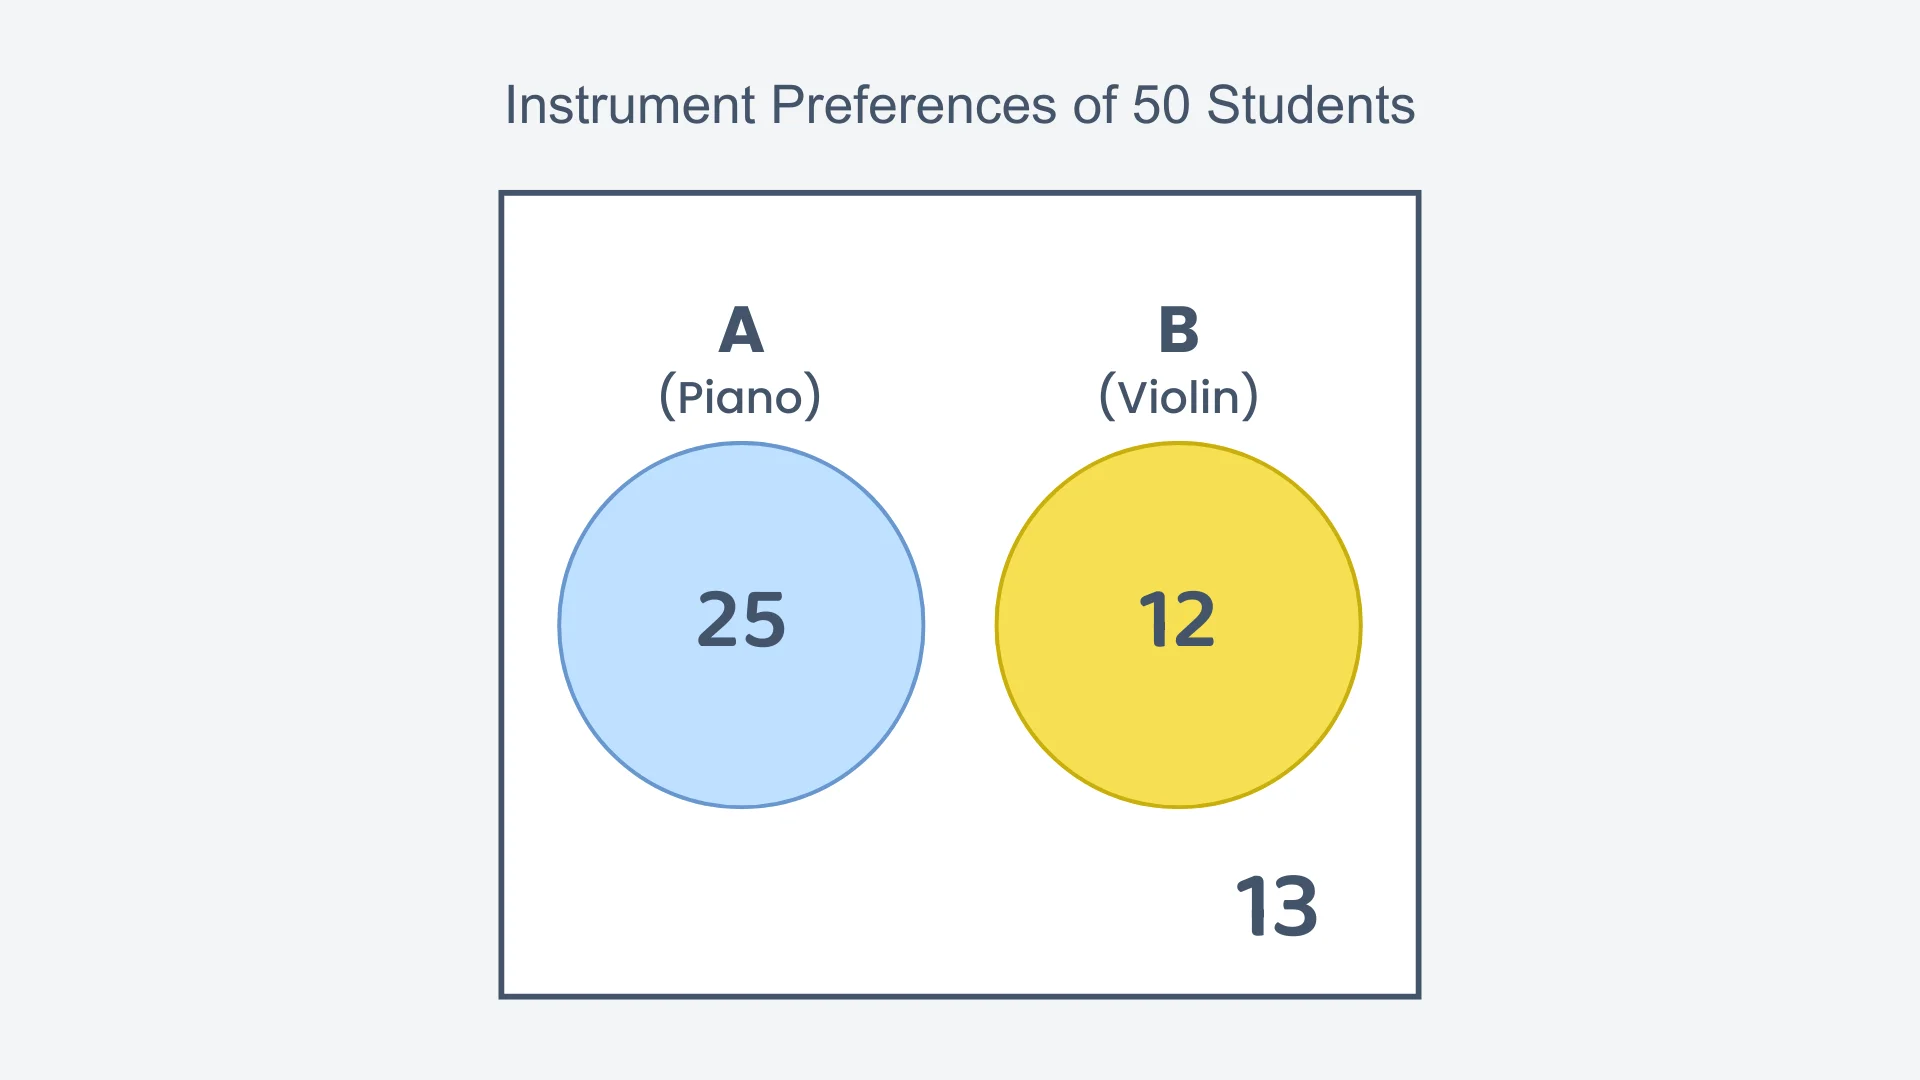
The Venn diagram shows the instrument preferences of 50 students. How many students prefer the piano?
Correct! 🎉 +10 pointsCorrect! 🎉 Worth 10 XPNot quite right
Set A is the piano circle, and the number written inside it is 25.
The 12 in circle B prefer the violin and the 13 outside both circles prefer neither, so neither group is counted here. So 25 students prefer the piano.
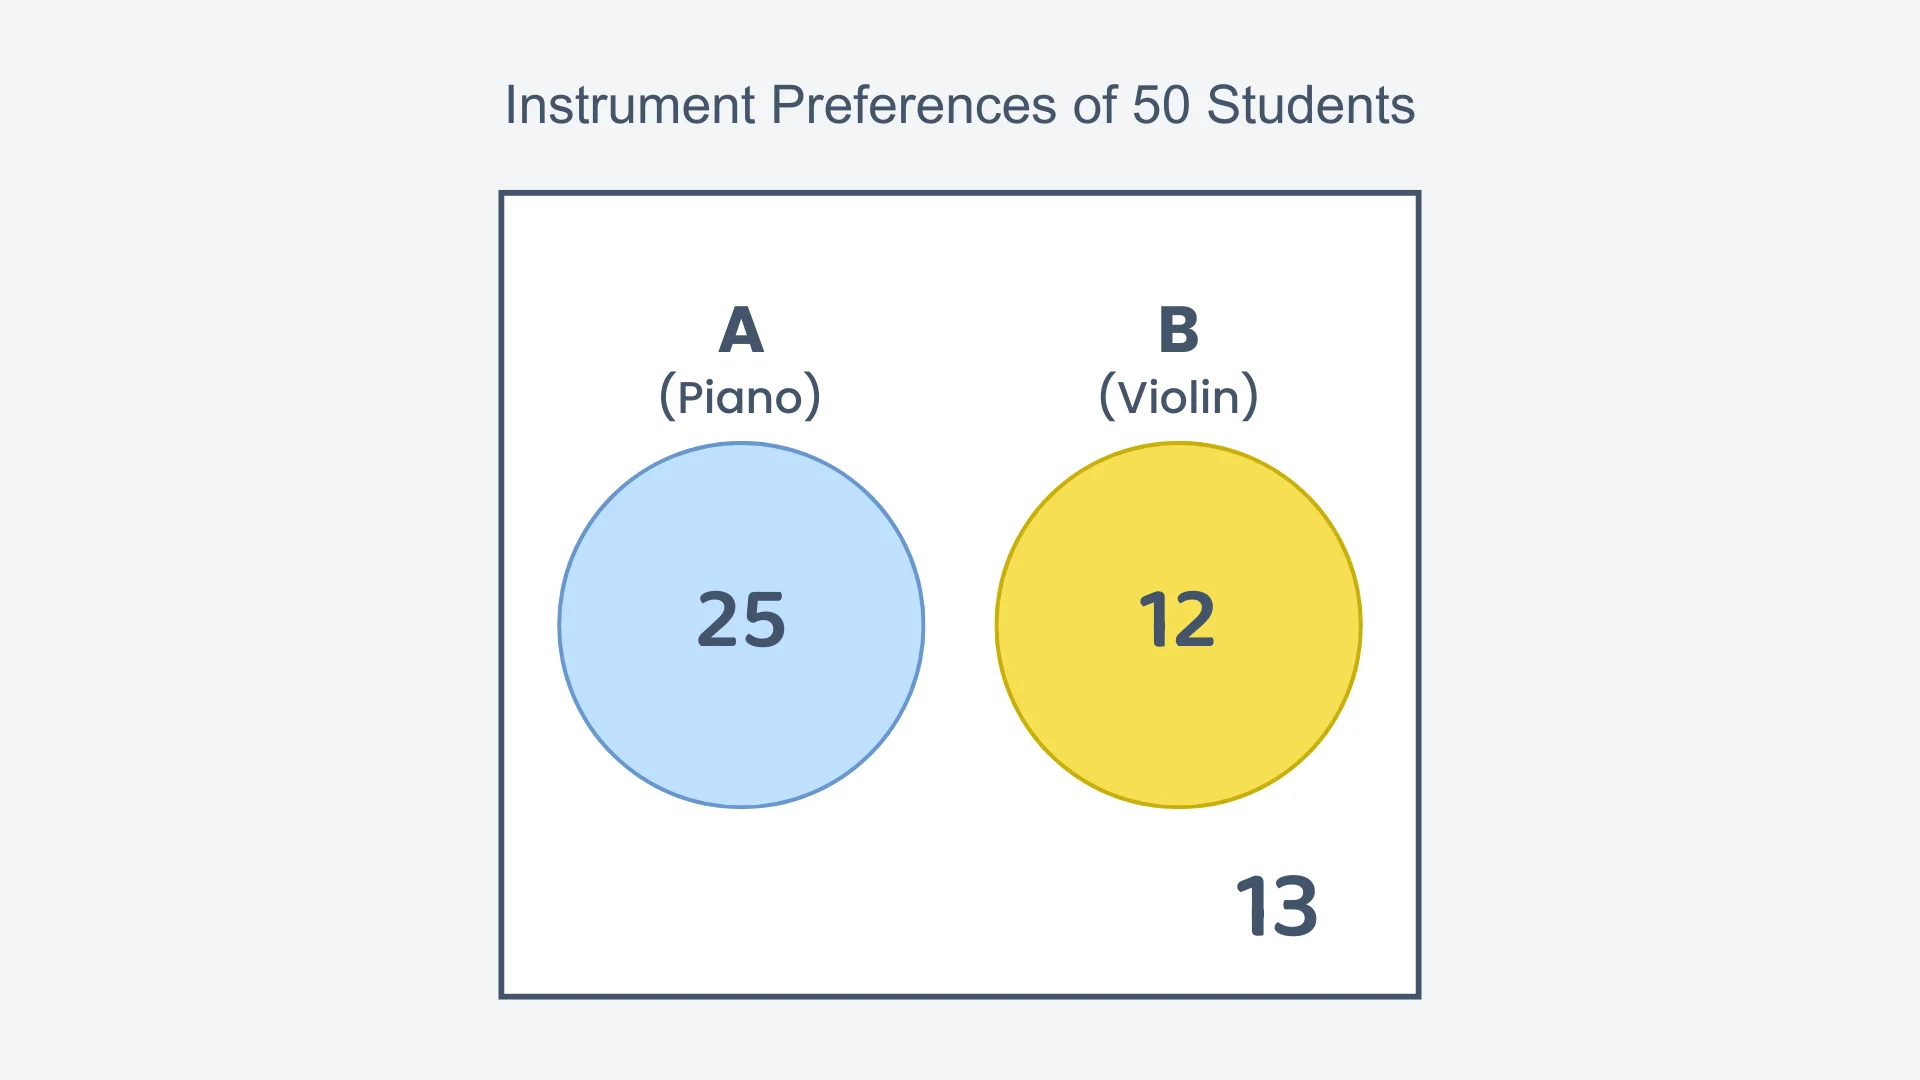
The Venn diagram shows the instrument preferences of 50 students. How many students prefer neither the piano nor the violin?
Correct! 🎉 +10 pointsCorrect! 🎉 Worth 10 XPNot quite right
'Neither' means inside the rectangle but outside both circles. The 13 written there is that group.
Check the whole diagram: students.
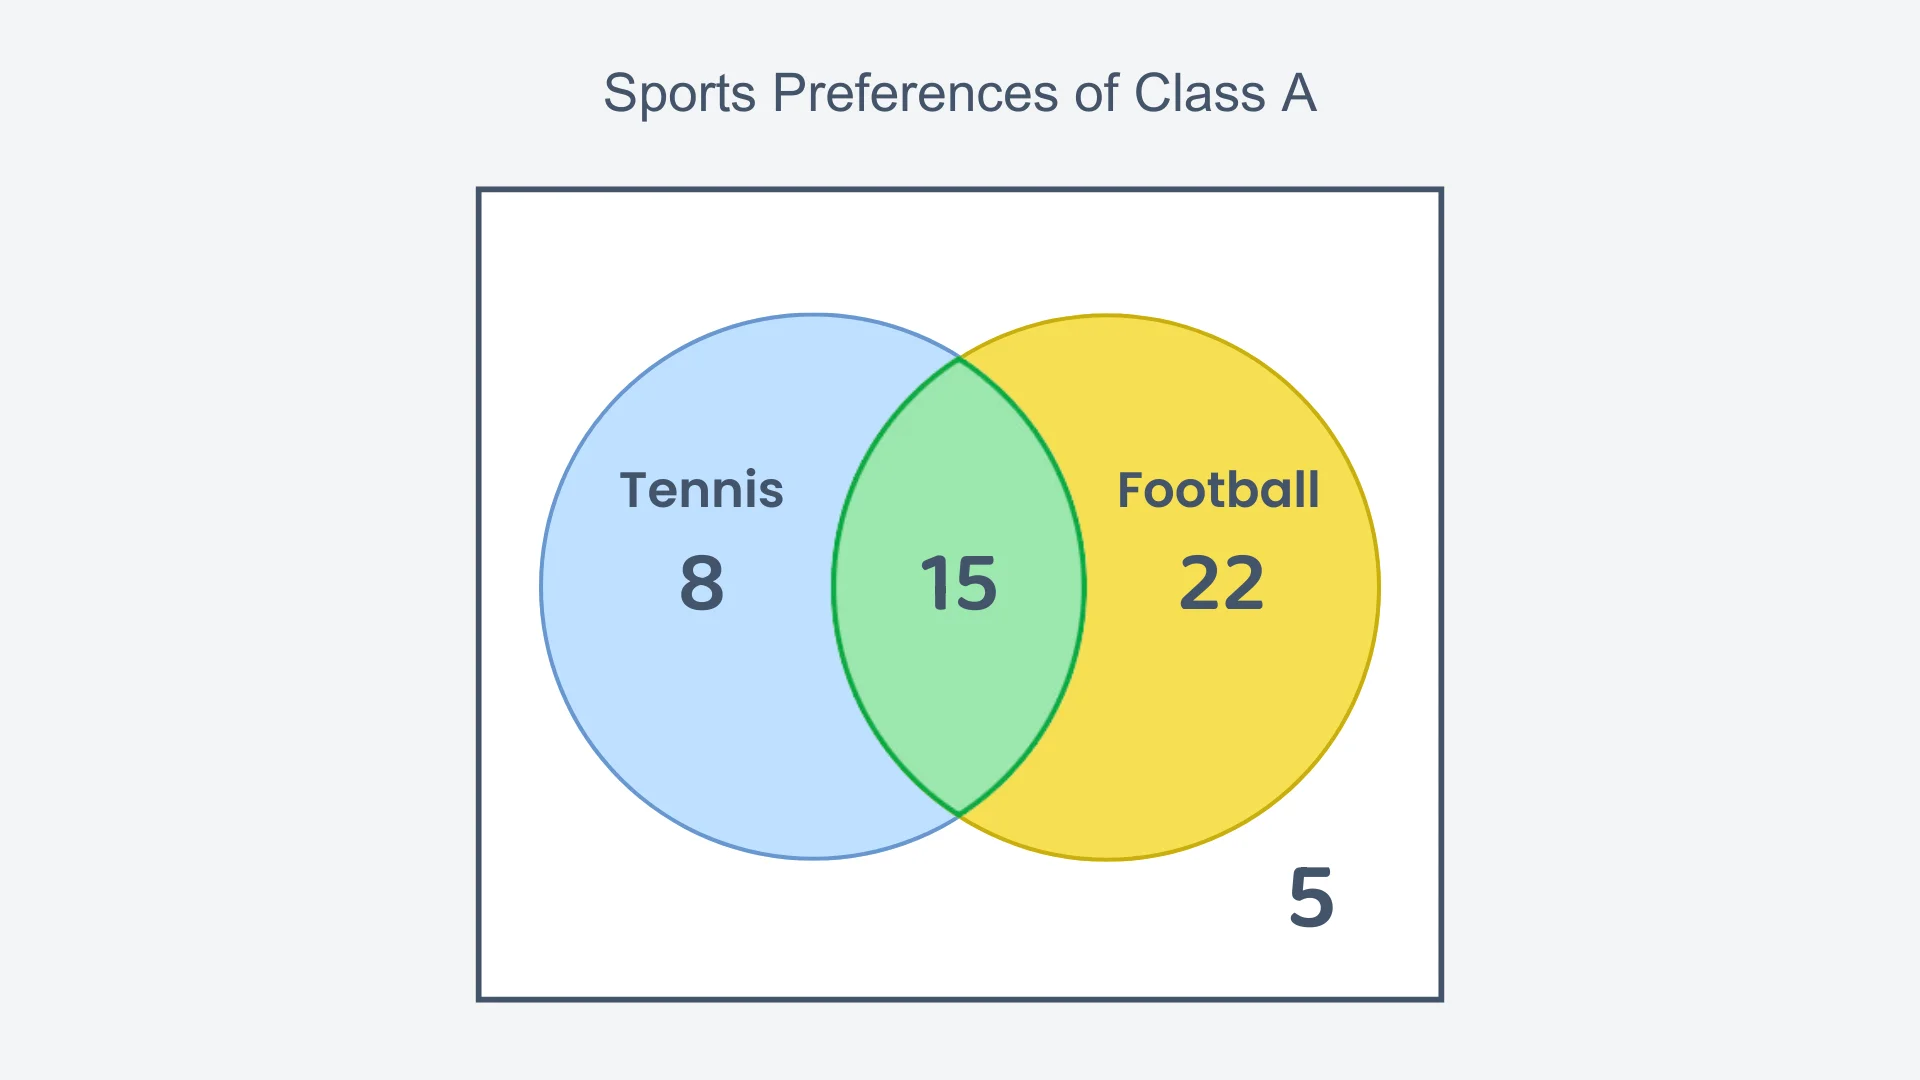
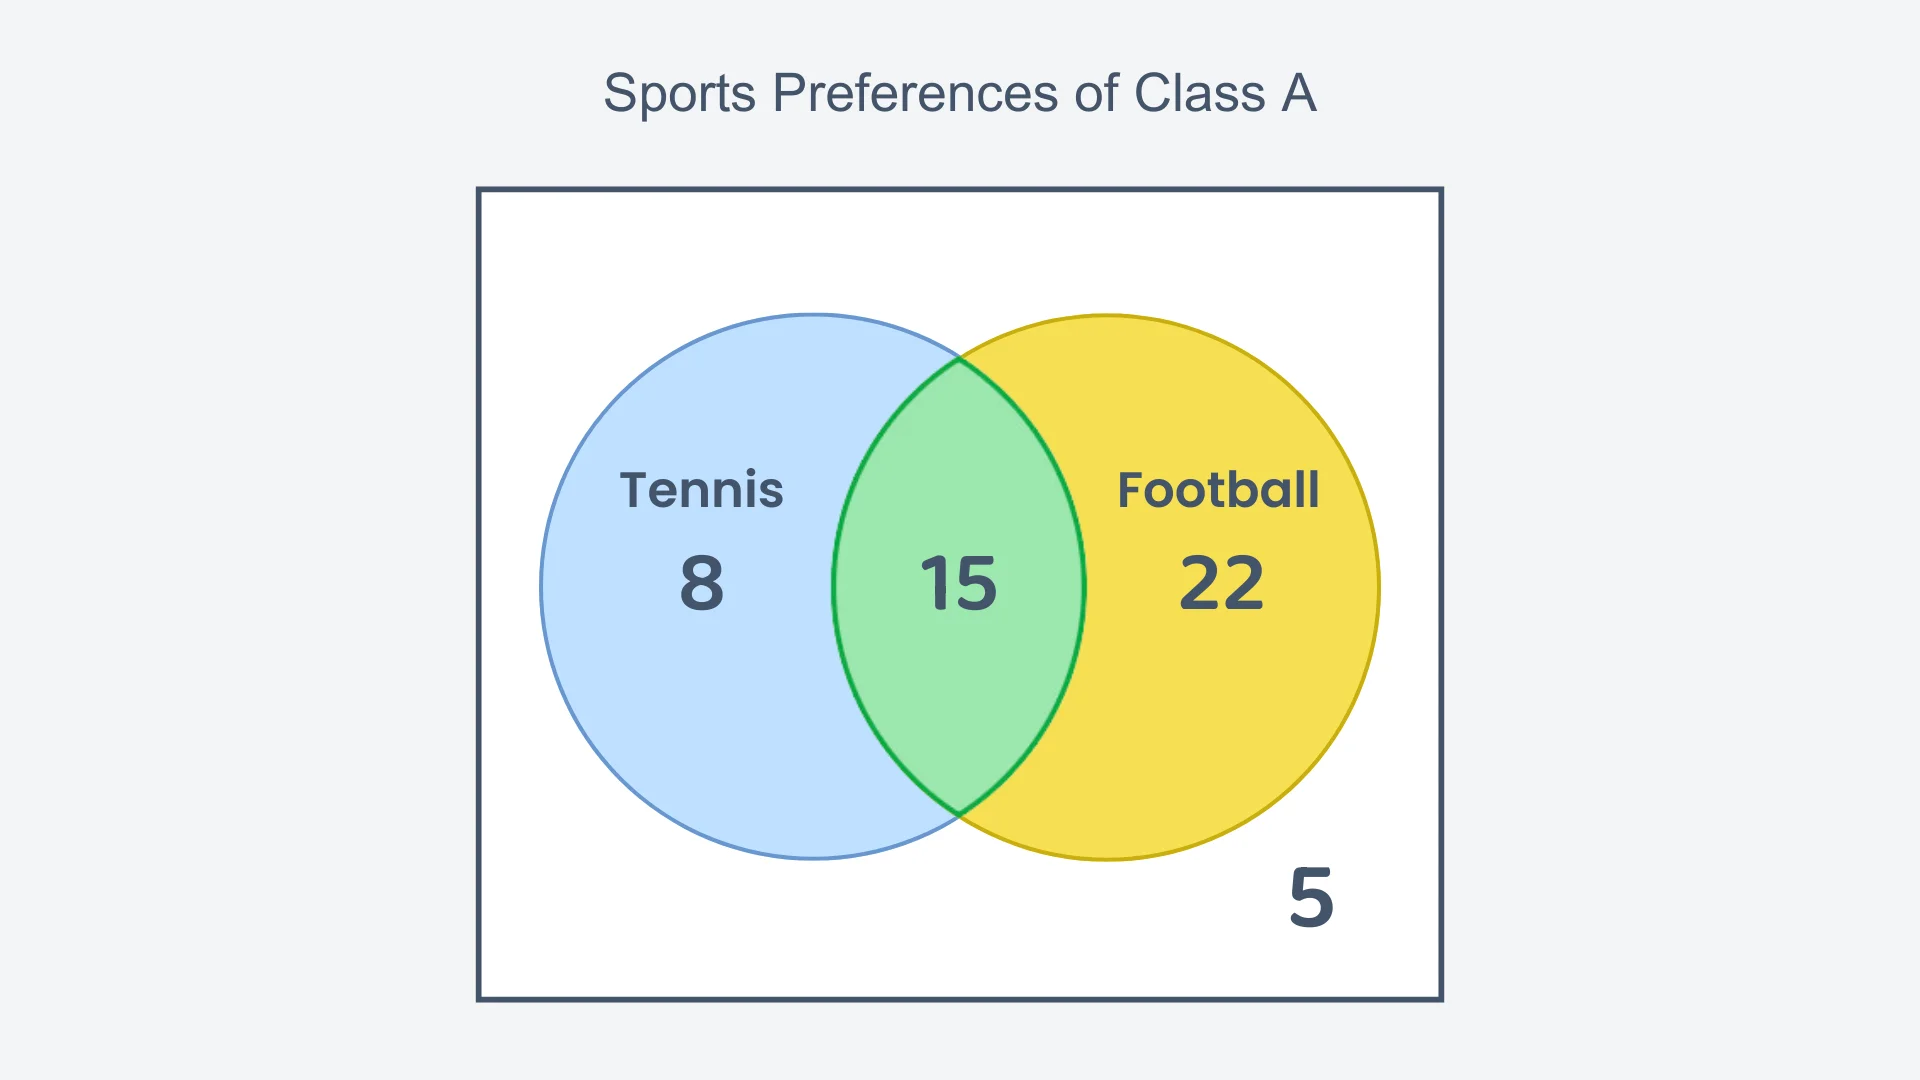
The Venn diagram shows the sports preferences of Class A. How many students prefer both tennis and football?
Correct! 🎉 +20 pointsCorrect! 🎉 Worth 20 XPNot quite right
'Both' is the region where the two circles overlap, and 15 is written there.
The 8 like only tennis, the 22 like only football and the 5 outside like neither, so none of those students are counted.
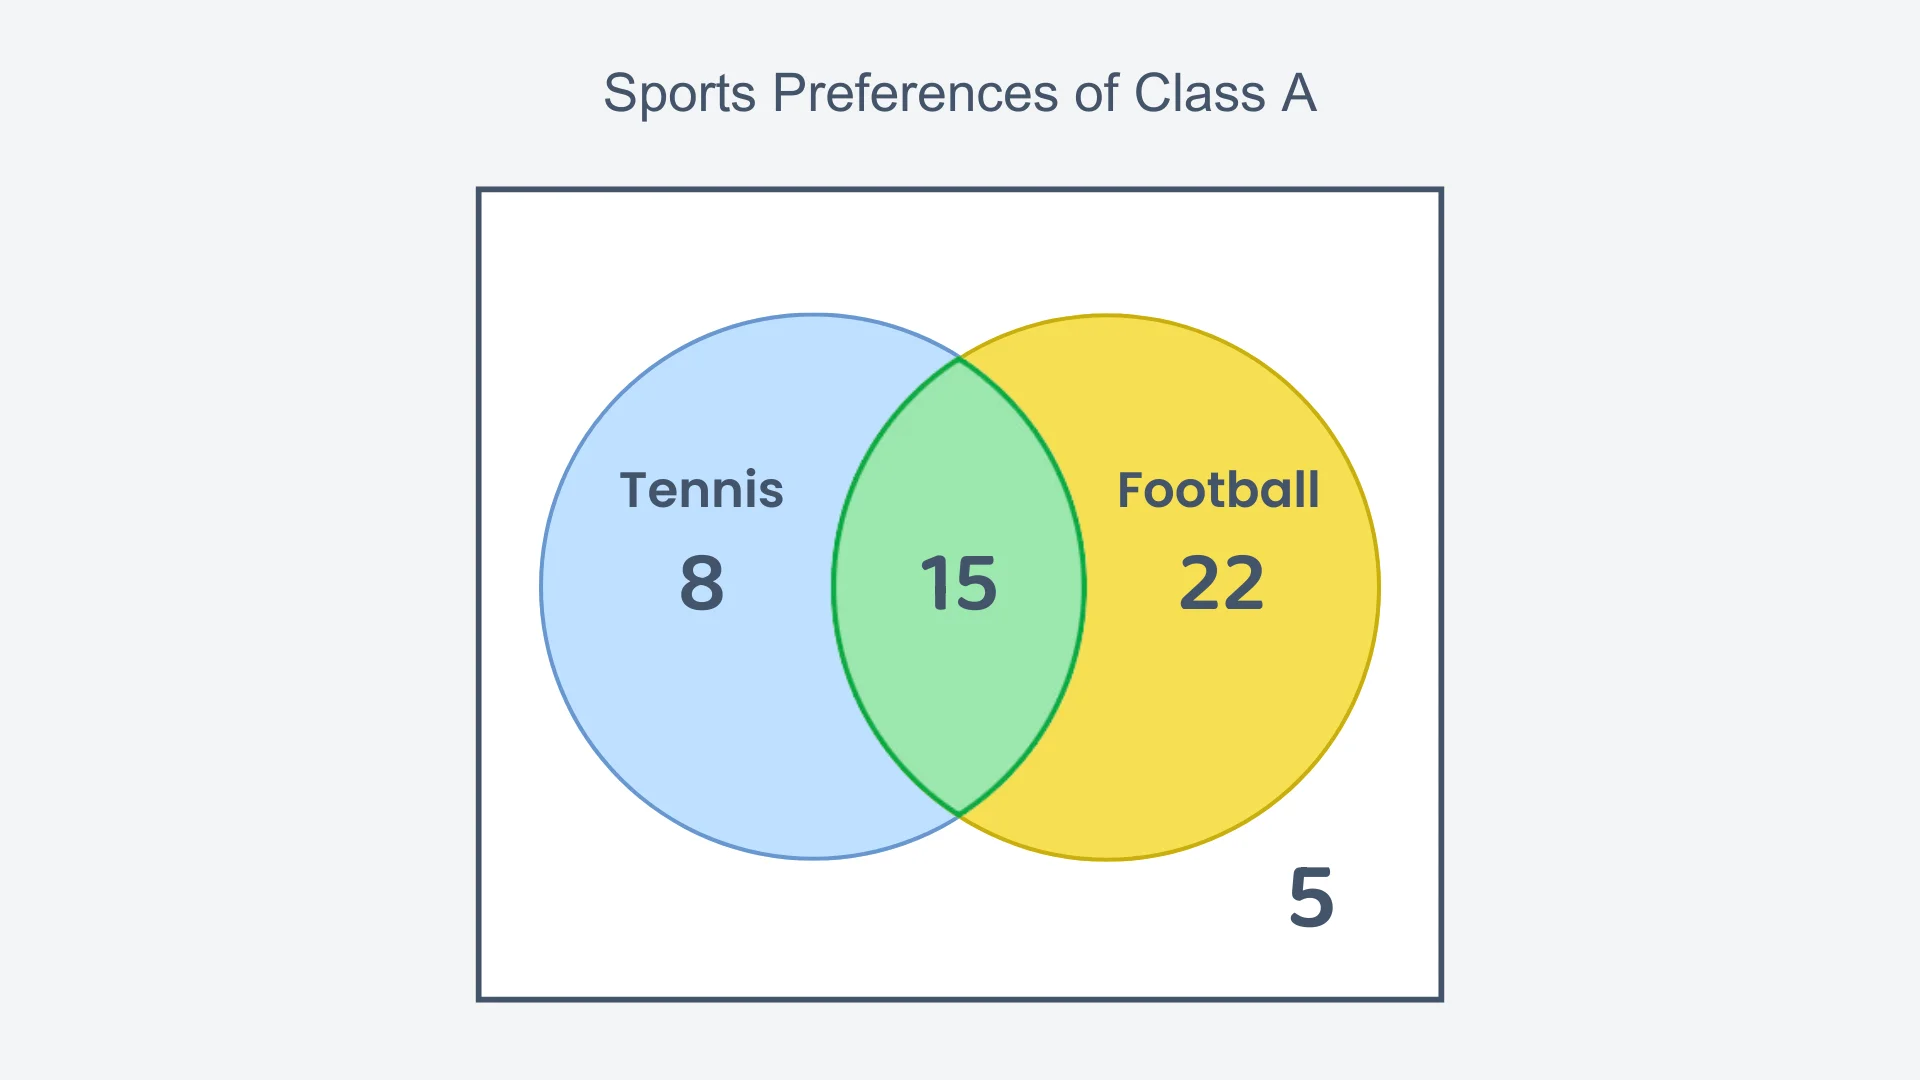
The Venn diagram shows the sports preferences of Class A. How many students prefer neither tennis nor football?
Correct! 🎉 +20 pointsCorrect! 🎉 Worth 20 XPNot quite right
'Neither' means inside the rectangle but outside both circles, and 5 is written there.
Check the whole diagram: students.
The Venn diagram shows the sports preferences of Class A. How many students are there in Class A altogether?
Correct! 🎉 +20 pointsCorrect! 🎉 Worth 20 XPNot quite right
Add every region of the diagram: 8 like only tennis, 15 like both, 22 like only football and 5 like neither.
, so there are 50 students in Class A.
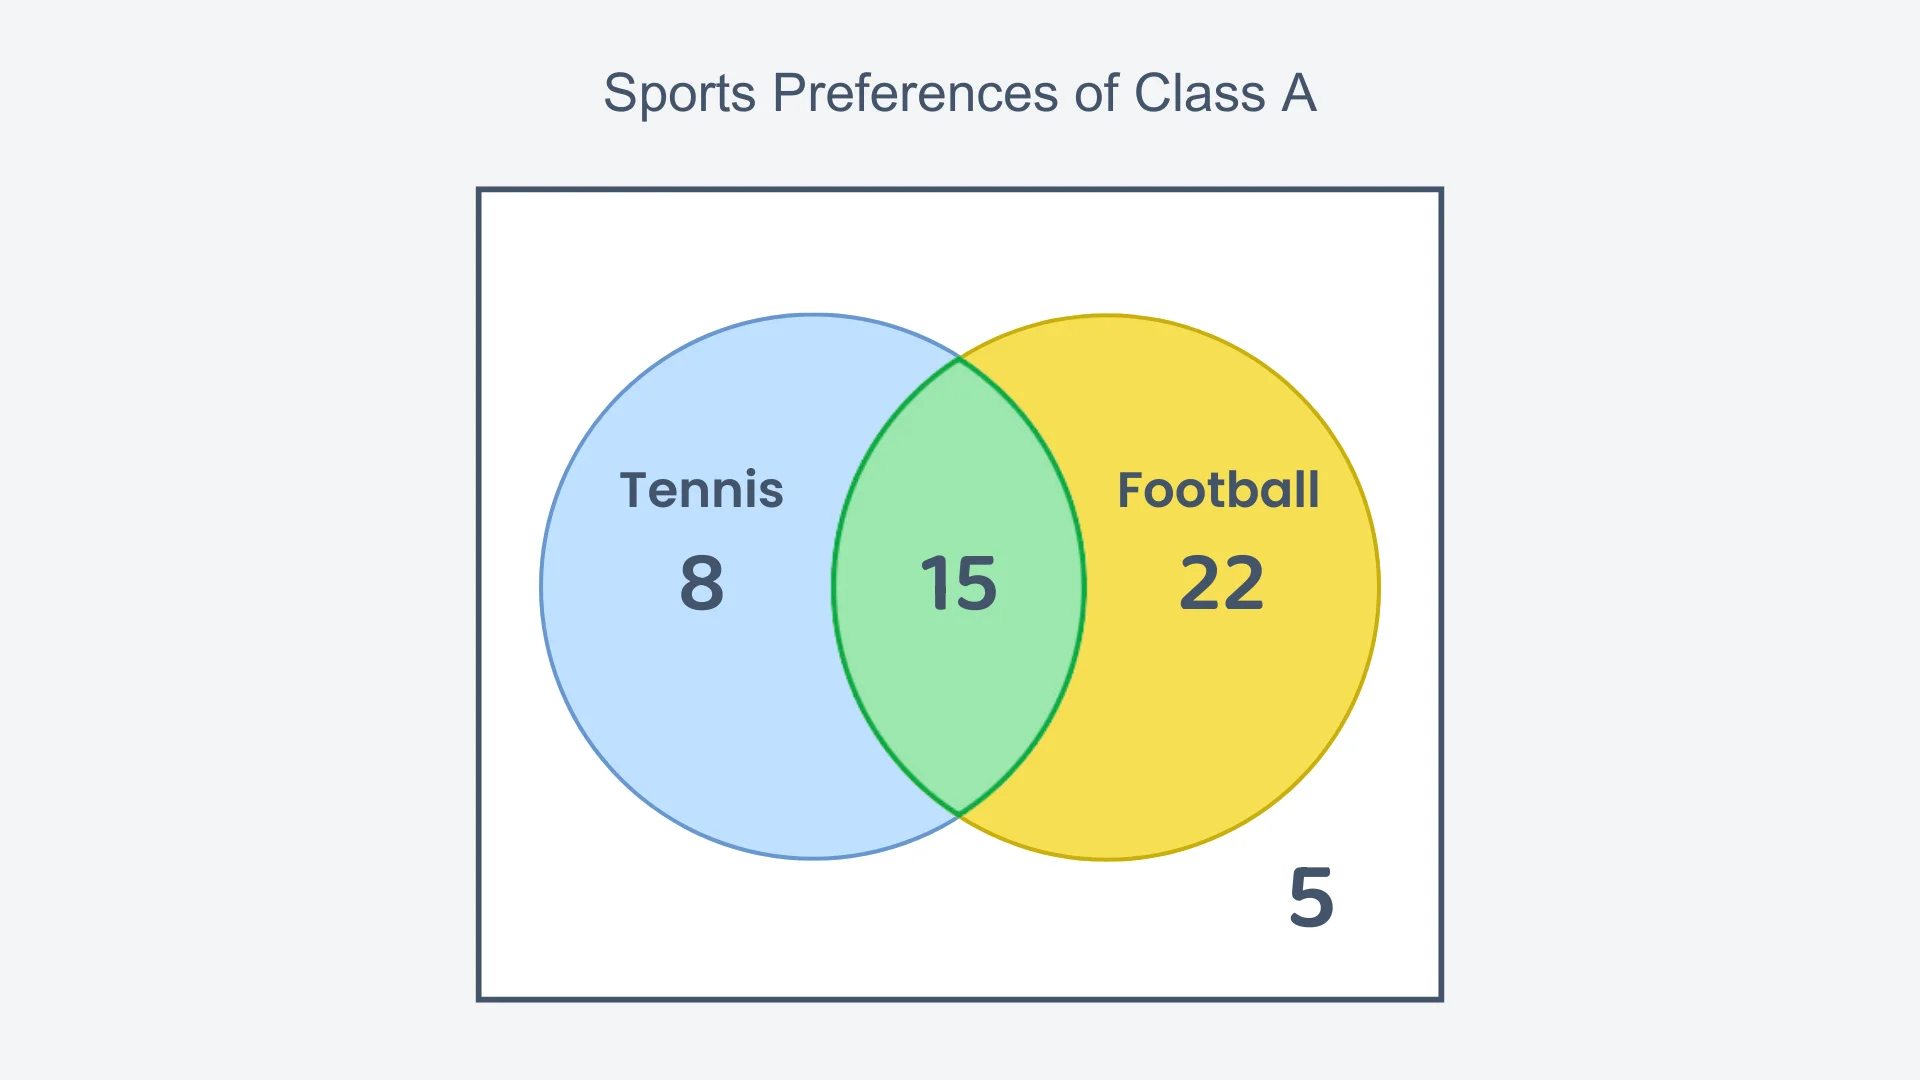
The Venn diagram shows the sports preferences of Class A. How many students like tennis, football, or both?
Correct! 🎉 +30 pointsCorrect! 🎉 Worth 30 XPNot quite right
'Tennis, football, or both' means everyone inside the two circles, so add the three regions there: 8 who like only tennis, 15 who like both and 22 who like only football.
. The 5 outside the circles are not included, because they like neither sport.
Want to see the full working?
Interactive Activity
Explore relationships between sets using Venn diagrams
Loading interactive widget...
Frequently asked questions
The questions students bump into most on this topic
A Venn diagram uses overlapping circles inside a box to show how sets are related; a set is a collection of distinct things. Ask 30 students about ice cream: one circle holds the 15 who like chocolate, another the 10 who like vanilla, the overlap those who like both, and the 5 outside like neither. Two circles are usual; three are possible.
∩ means “and”: A ∩ B is the intersection, the elements in both sets, the overlap of the circles. ∪ means “or”: A ∪ B is the union, everything in either set or both. If 10 students like both chocolate and vanilla, A ∩ B has 10; if 4 like only chocolate and 8 only vanilla, A ∪ B has 4 + 10 + 8 = 22.
The complement of a set is everything in the universal set that is not in it, written B′ or with a bar over the B. If B is the 10 students who like vanilla out of 30, then B′ is the students who do not: 30 − 10 = 20. On the diagram it is every region outside that circle, including the people outside both circles.
Read the numbers region by region and add the ones the question asks for. How many like chocolate? Add both parts of the chocolate circle: 14. How many students in total? Add every number inside the box: 28. How many do not like vanilla? Add every number outside the vanilla circle, or subtract the vanilla circle from the total: 10 either way.
The universal set, labelled U, is everything being considered, drawn as the box around the circles. In the ice cream survey it is all 30 students, including the 5 who sit outside both circles. To find the total, add every region inside the box, counting each number once: 15 + 10 + 5 = 30 is the quick check.
Put two hoops on the floor so they overlap. One hoop is “likes chocolate”, the other “likes vanilla”. Each person stands in their hoop; anyone who likes both stands in the overlap, and anyone who likes neither stands outside. Then count: that is all a Venn diagram does.
What's next?
Found this one hard? Go one step back first. Feeling confident? Carry on to the next lesson.