
Statistics
The complete statistics curriculum for ages 10 to 16, with every topic taught in its own bite-sized video lesson. Build real confidence at your own pace, with an AI tutor whenever you get stuck.
Video lessonsFlashcardsPractice questionsAI helpInteractive tools
Flashcards
Review key concepts visually
%20Tally%20Mark%20Chart.webp)
Interactive Practice
Read the value off the chart
Video Lesson
Watch and learn the basics
%20Box%20Plots.webp)
Explore every Statistics topic
Averages, bar charts, pie charts and box plots. Master each one with interactive tools and practice questions.
4Lessons
Video Lesson
Watch and learn the basics
Topic 01
Charts and Data Display
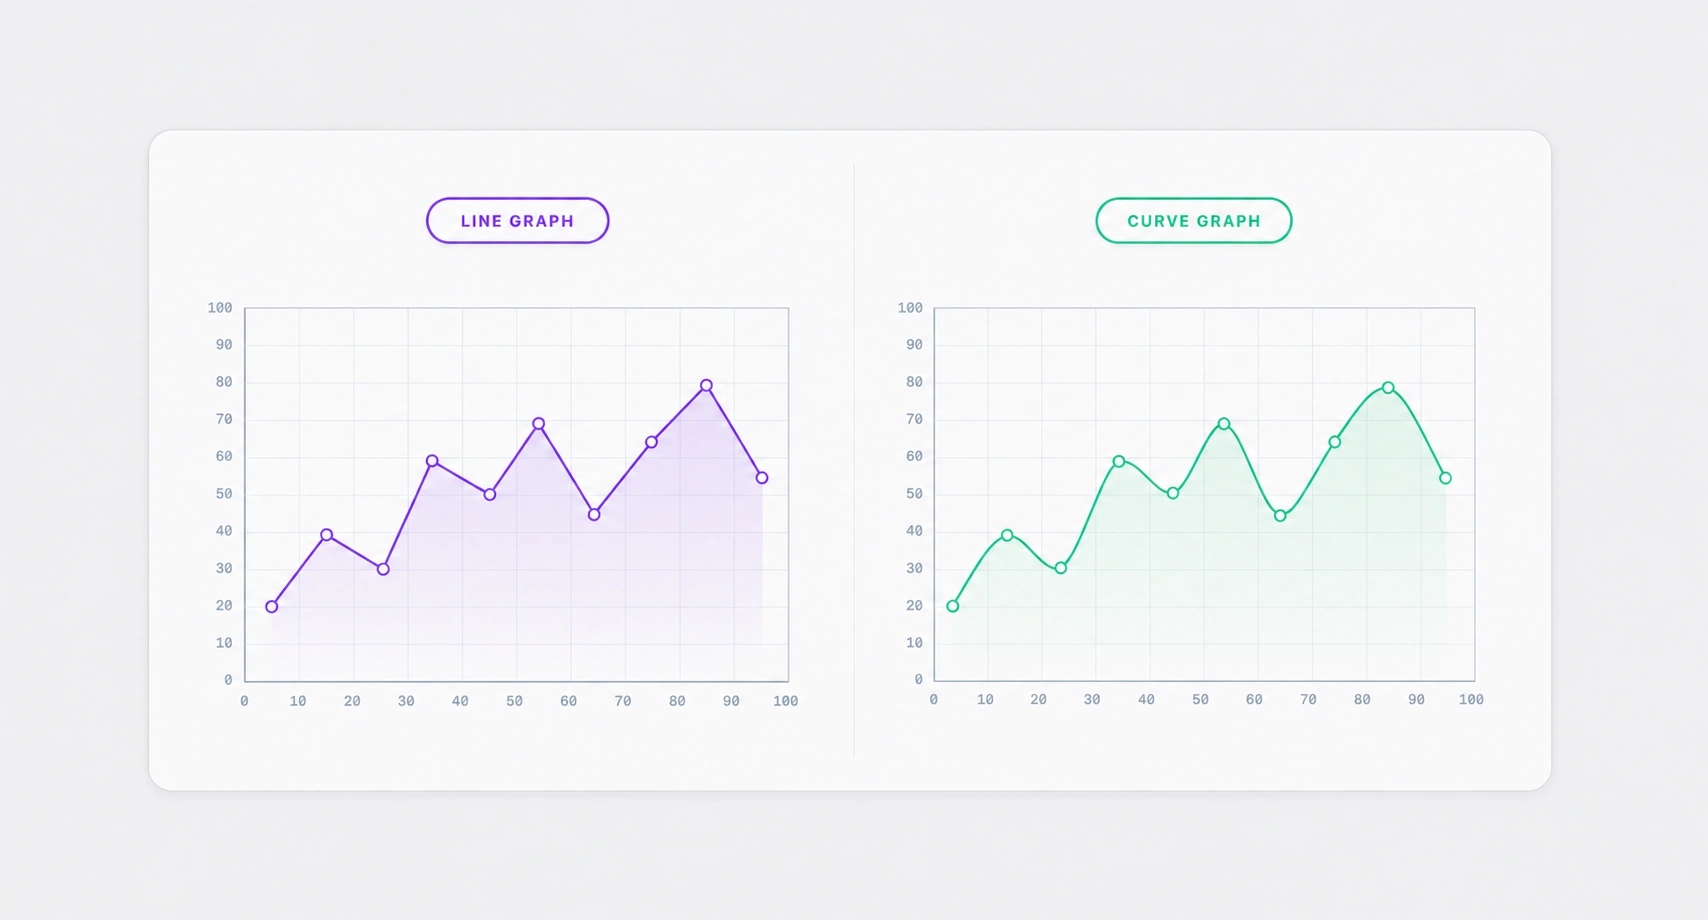
Collect, organise and present data with tables, bar charts, pie charts and line graphs.
4Lessons%20Mean.webp)
Video Lesson
Watch and learn the basics
Topic 02
Averages and Spread
Summarise data with the mean, median, mode and range, then read box plots and frequency tables.
Explore other Maths categories
Maths Angel covers the whole maths curriculum for ages 10 to 16. Statistics is one of six categories, so jump into any of the others.
NumberPlace value, fractions, percentages and the four operations.AlgebraExpressions, equations, sequences and graphs.Ratio, Proportion and Rates of ChangeSharing in ratios, direct and inverse proportion, rates.Geometry and MeasuresAngles, area, volume and trigonometry.ProbabilityLikelihood, tree diagrams and combined events.