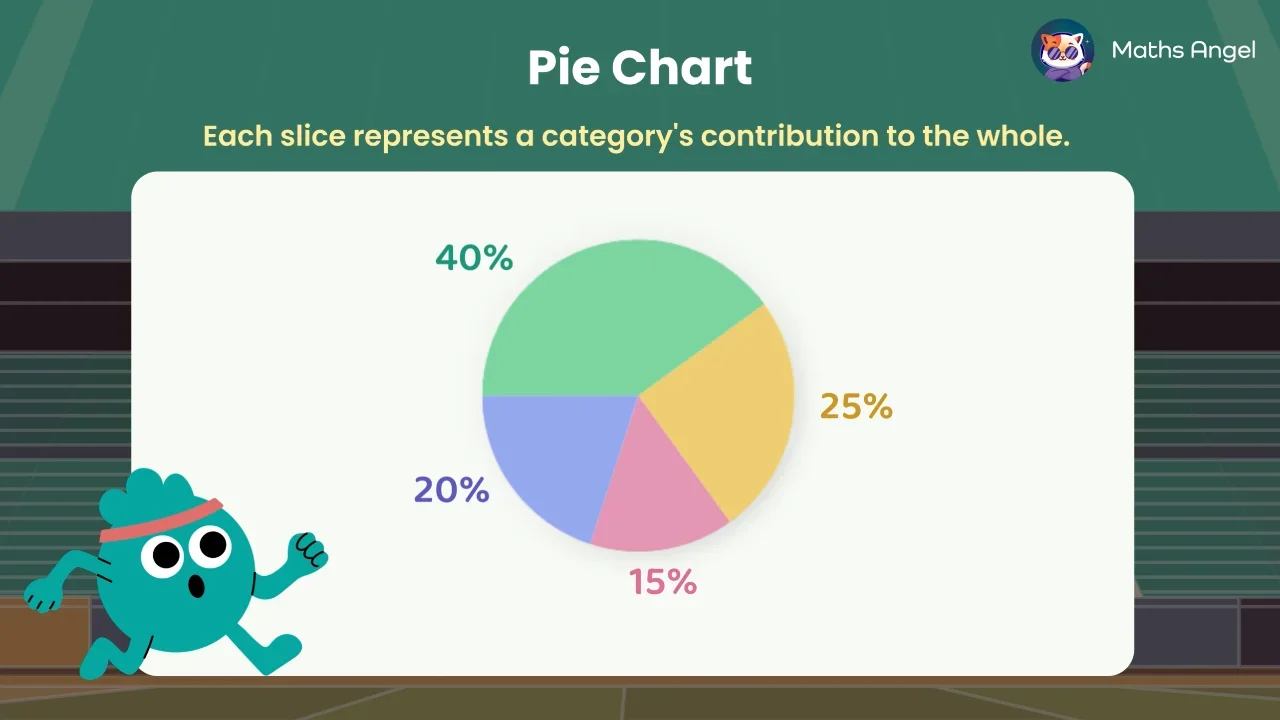
Pie Chart
A pie chart shows data as slices of a circle, each slice a part of the whole. To draw one, find each central angle using frequency ÷ total × 360°, so 25 of 100 gives 90°. Together the slices fill the whole circle of 360°.
Video Lesson
Watch and learn the basics
🎬 Did this video explain it clearly?
Flashcards
Review key concepts visually
%20Pie%20Chart.webp)
%20How%20to%20Draw%20a%20Pie%20Chart.webp)
%20How%20to%20Read%20a%20Pie%20Chart.webp)
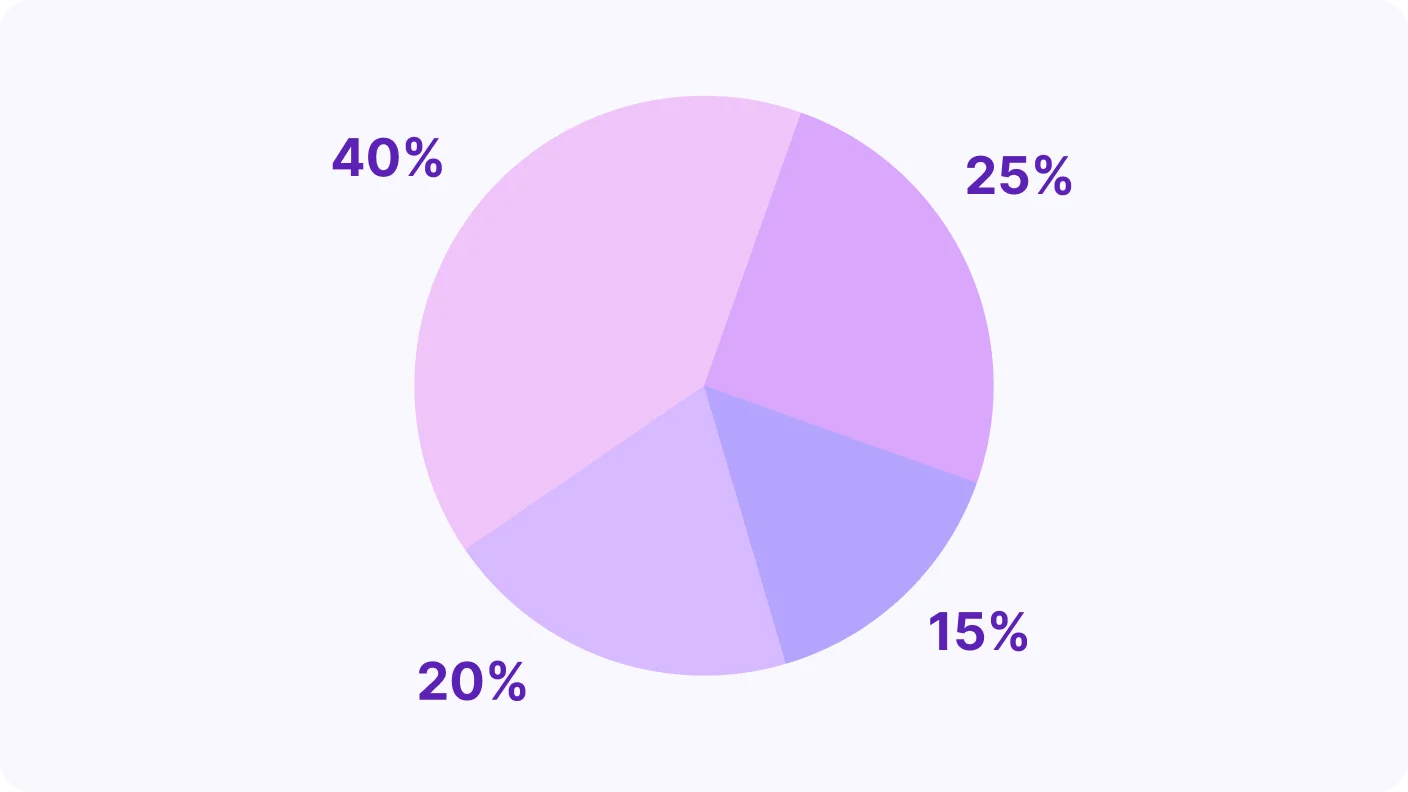
What Is a Pie Chart?
- A pie chart shows how each category is a part of the whole.
- Each slice represents a fraction or percentage of the total.
How to Draw a Pie Chart
- Find each central angle using frequency ÷ total × .
- Draw the circle, measure each angle, and label the categories.
Reading a Pie Chart
- Use angle ÷ × total to find the number in a category.
- Larger angles mean a bigger proportion of the whole.
Practice Questions
Test your understanding
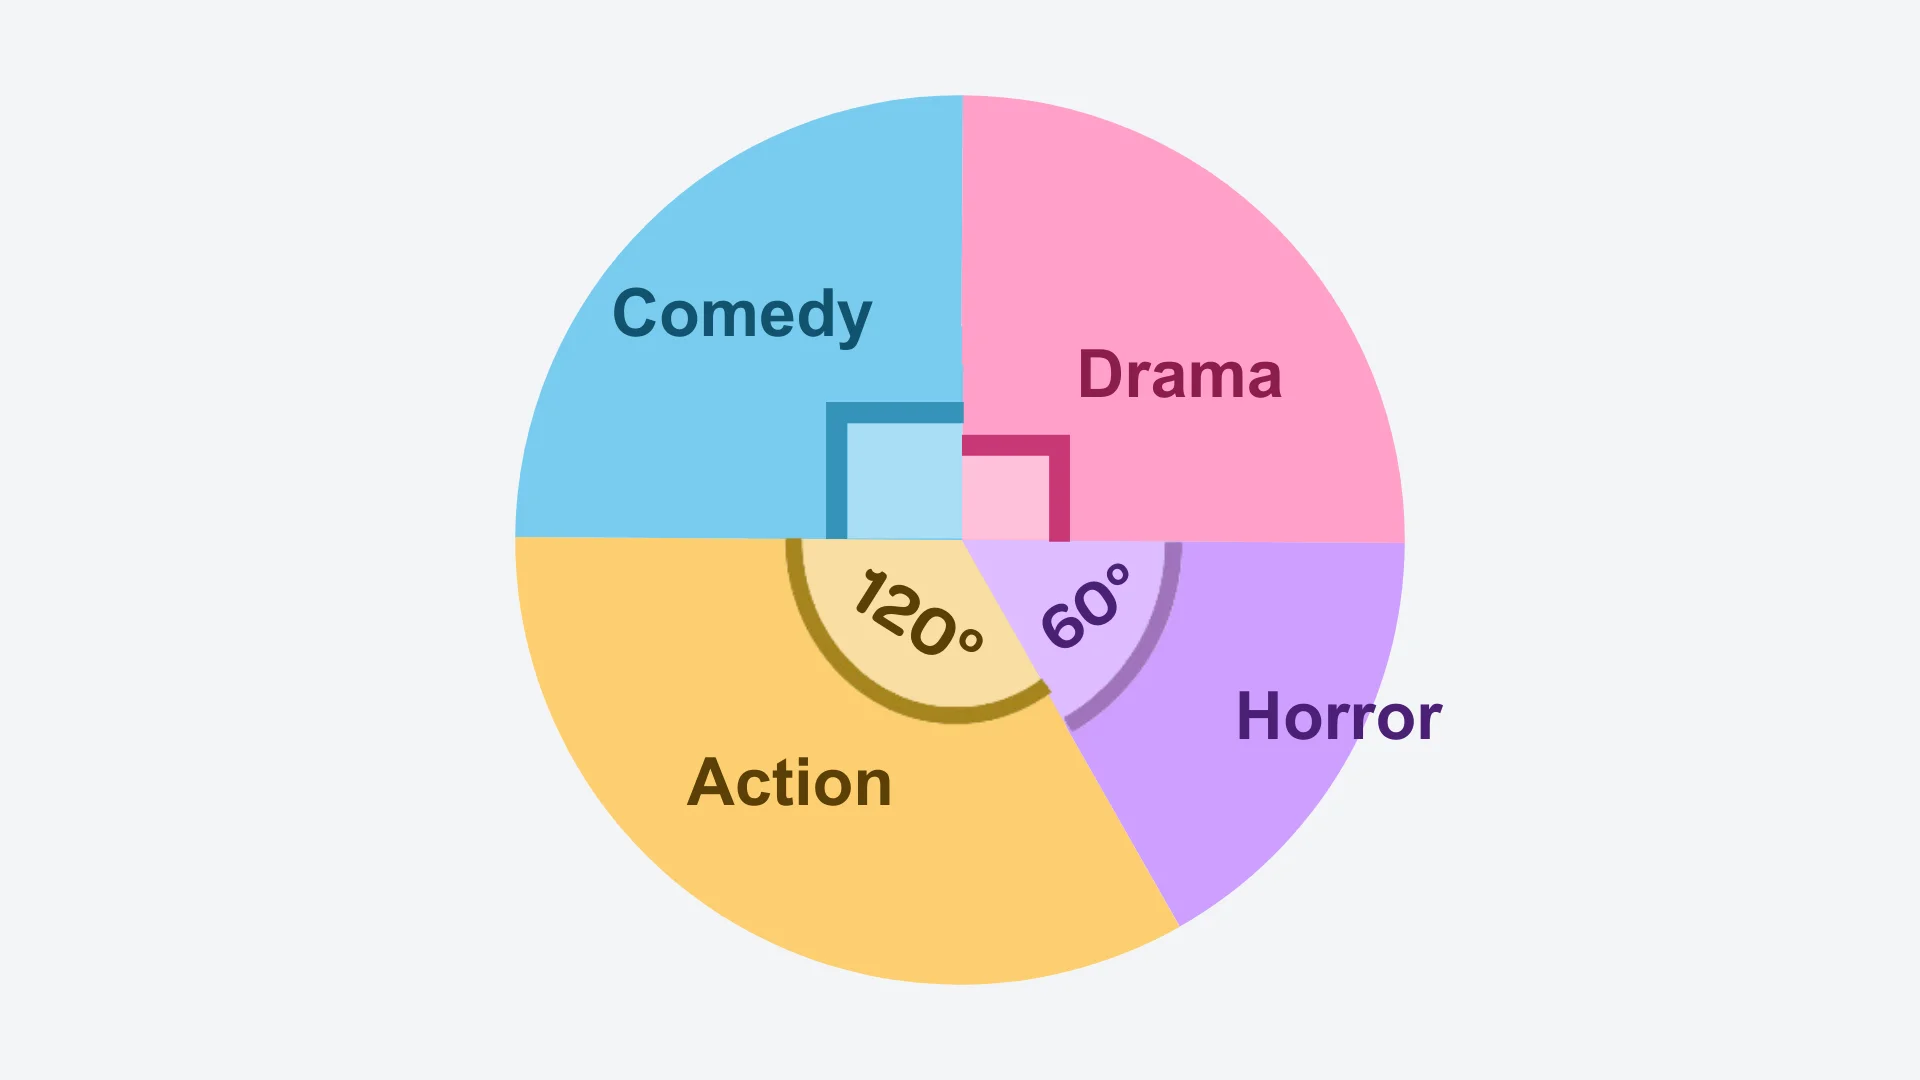
The pie chart shows the favourite genres of movies among 80 students. How many students prefer Comedy?
Correct! 🎉 +10 pointsNot quite right
Divide the central angle for Comedy by : . Multiply by the total number of students: students.
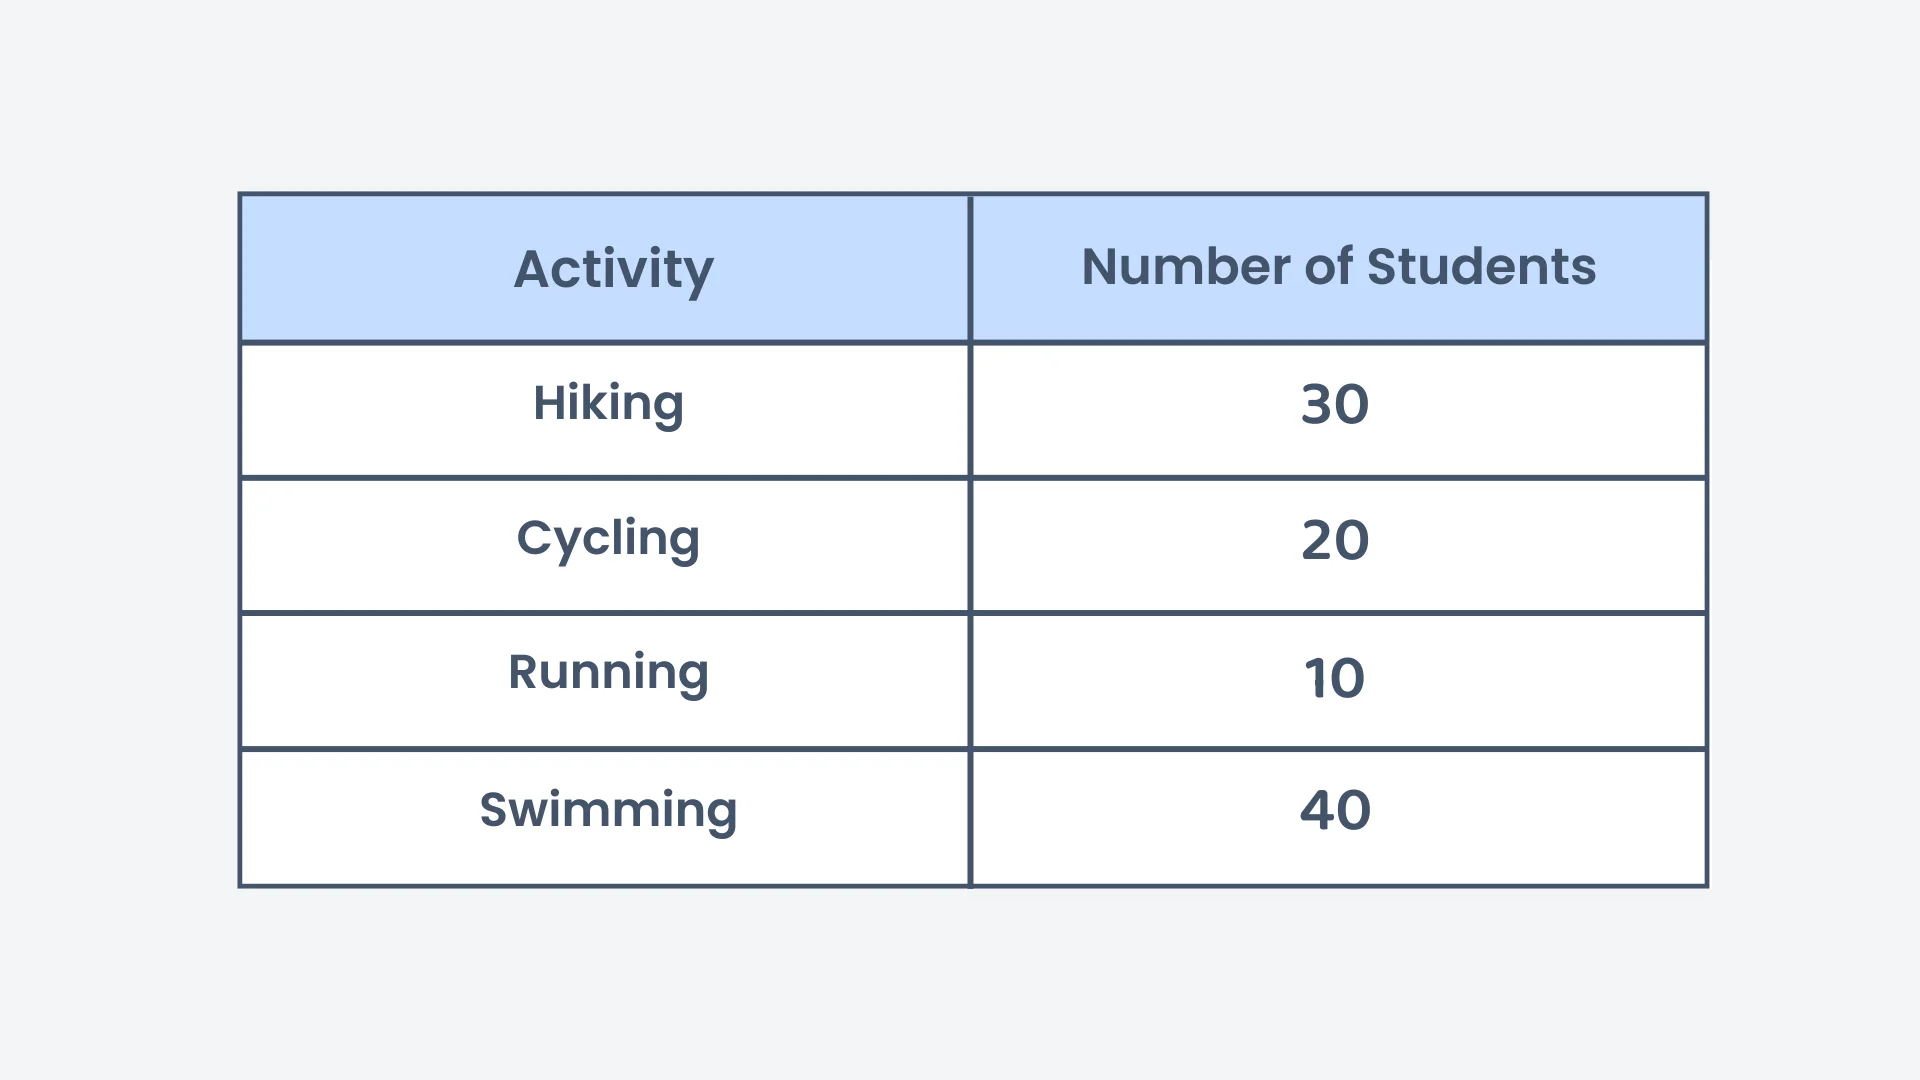
The table below shows favourite outdoor activities among students. What is the central angle for Cycling?
Correct! 🎉 +10 pointsNot quite right
Divide the number of students who chose Cycling by the total number of students, then multiply by : .
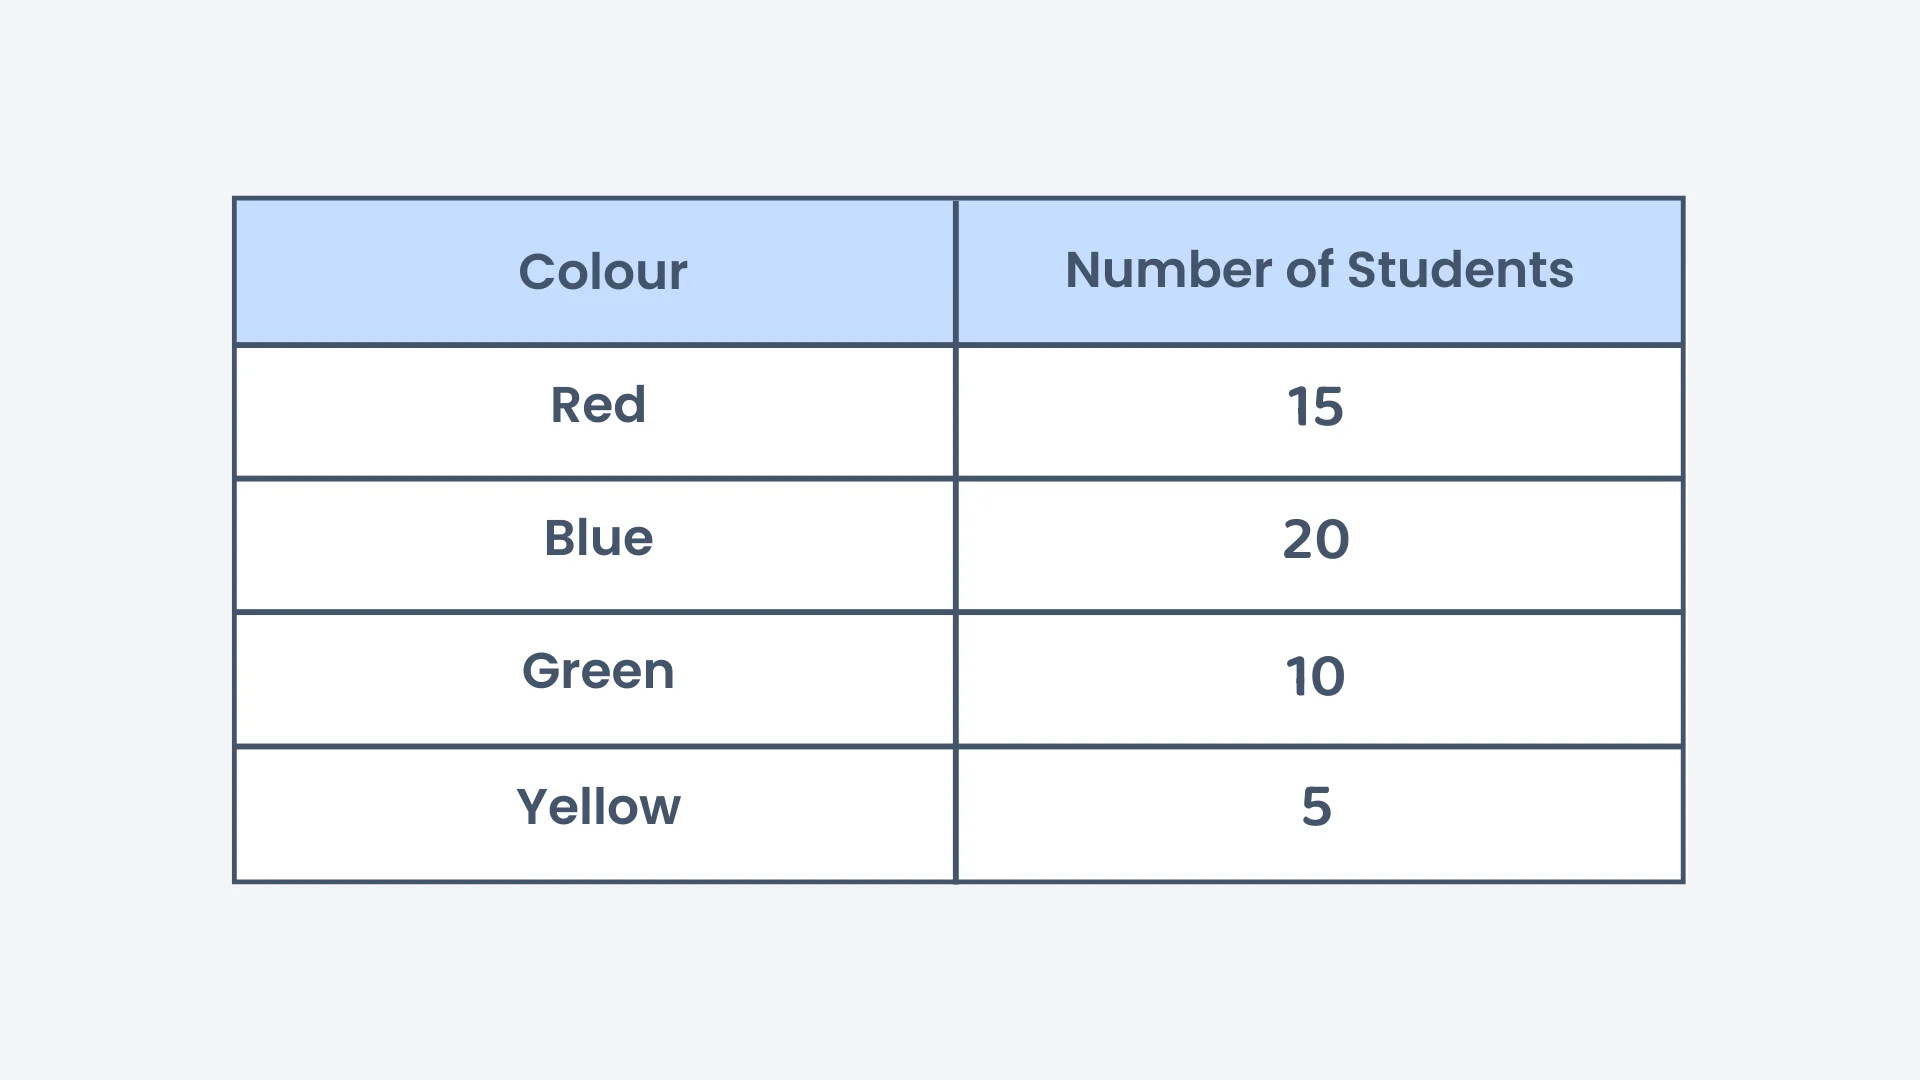
The table below shows the favourite colours of 50 students. What is the central angle for Blue?
Correct! 🎉 +20 pointsNot quite right
Divide the number of students who chose Blue by the total number of students and multiply by : .
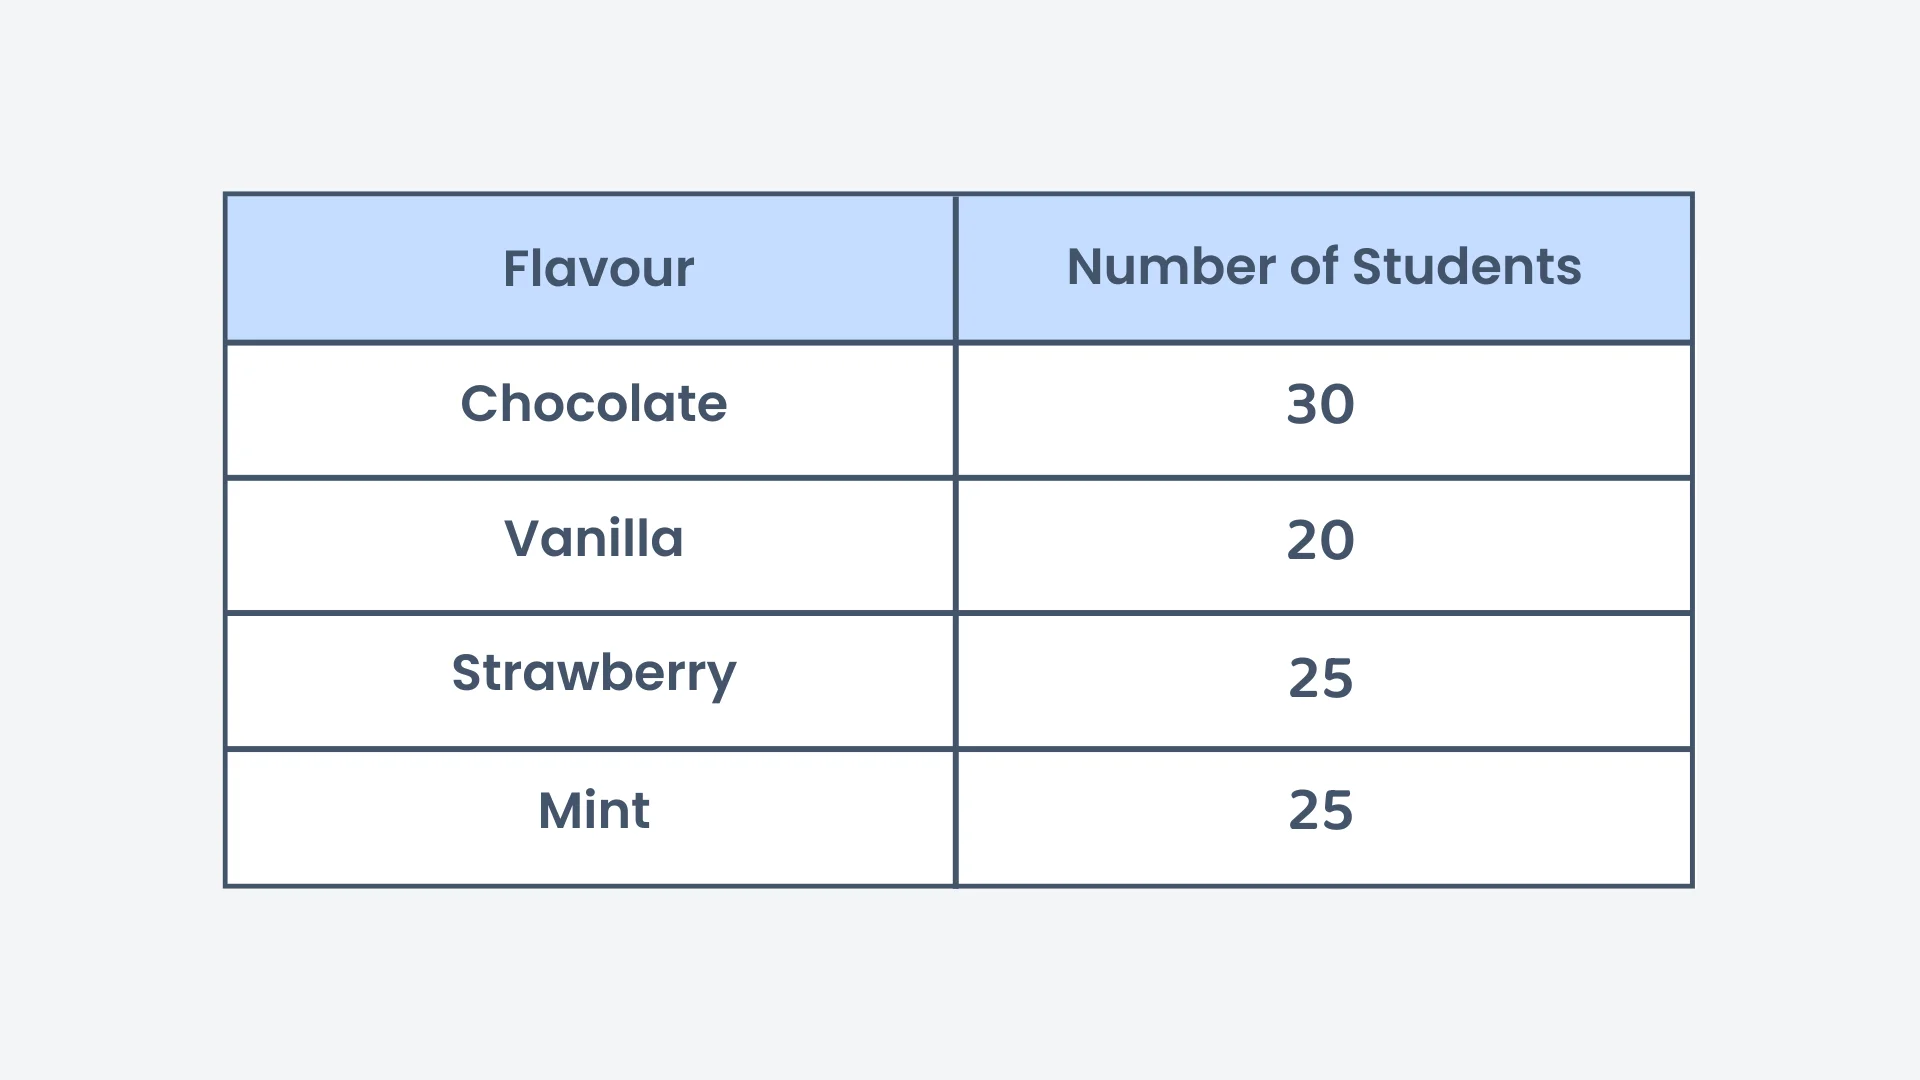
The table below shows students' favourite ice cream flavours. What is the central angle for Strawberry?
Correct! 🎉 +20 pointsNot quite right
The total number of students is 100. Strawberry has 25 students, so .
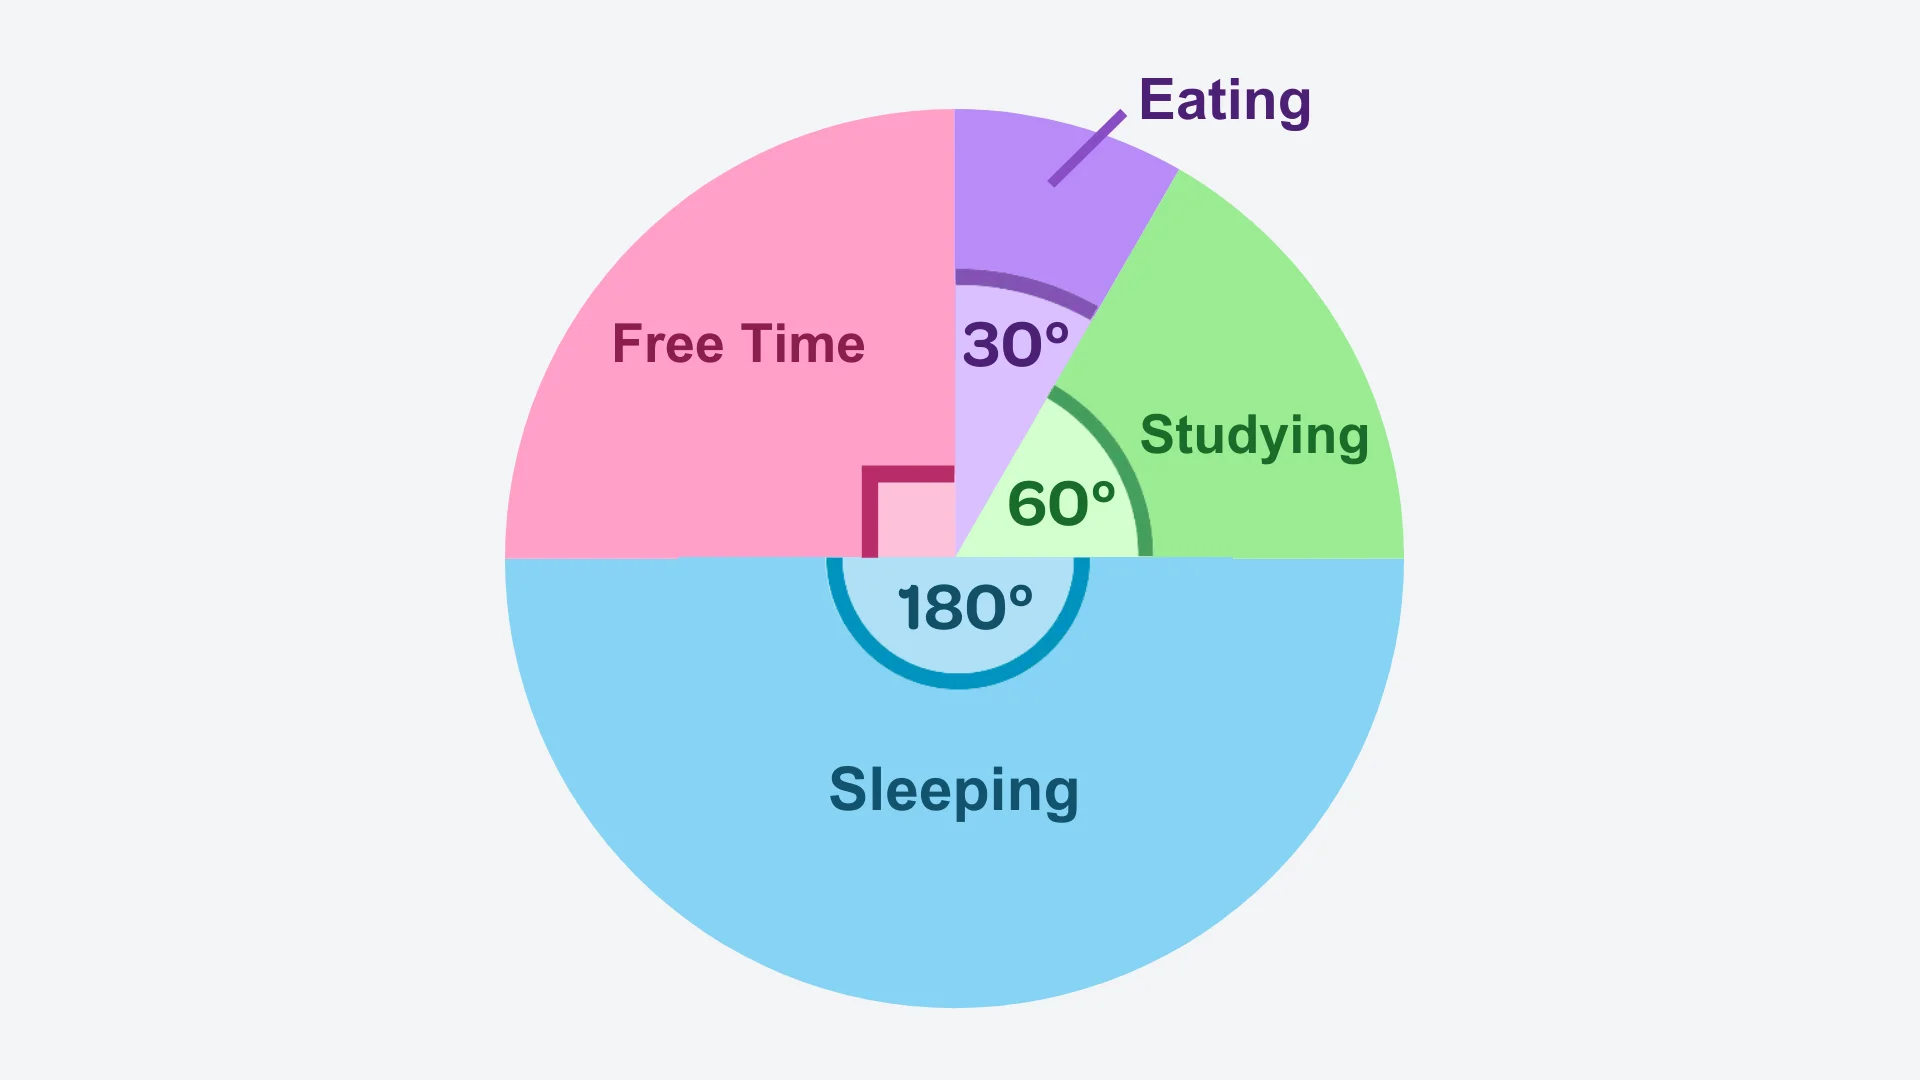
The pie chart shows the time spent on different activities during the day. What is the total time spent on Studying if the total hours in a day are 24?
Correct! 🎉 +20 pointsNot quite right
The central angle for Studying is . The fraction of the day is . Multiply by 24 hours: hours.
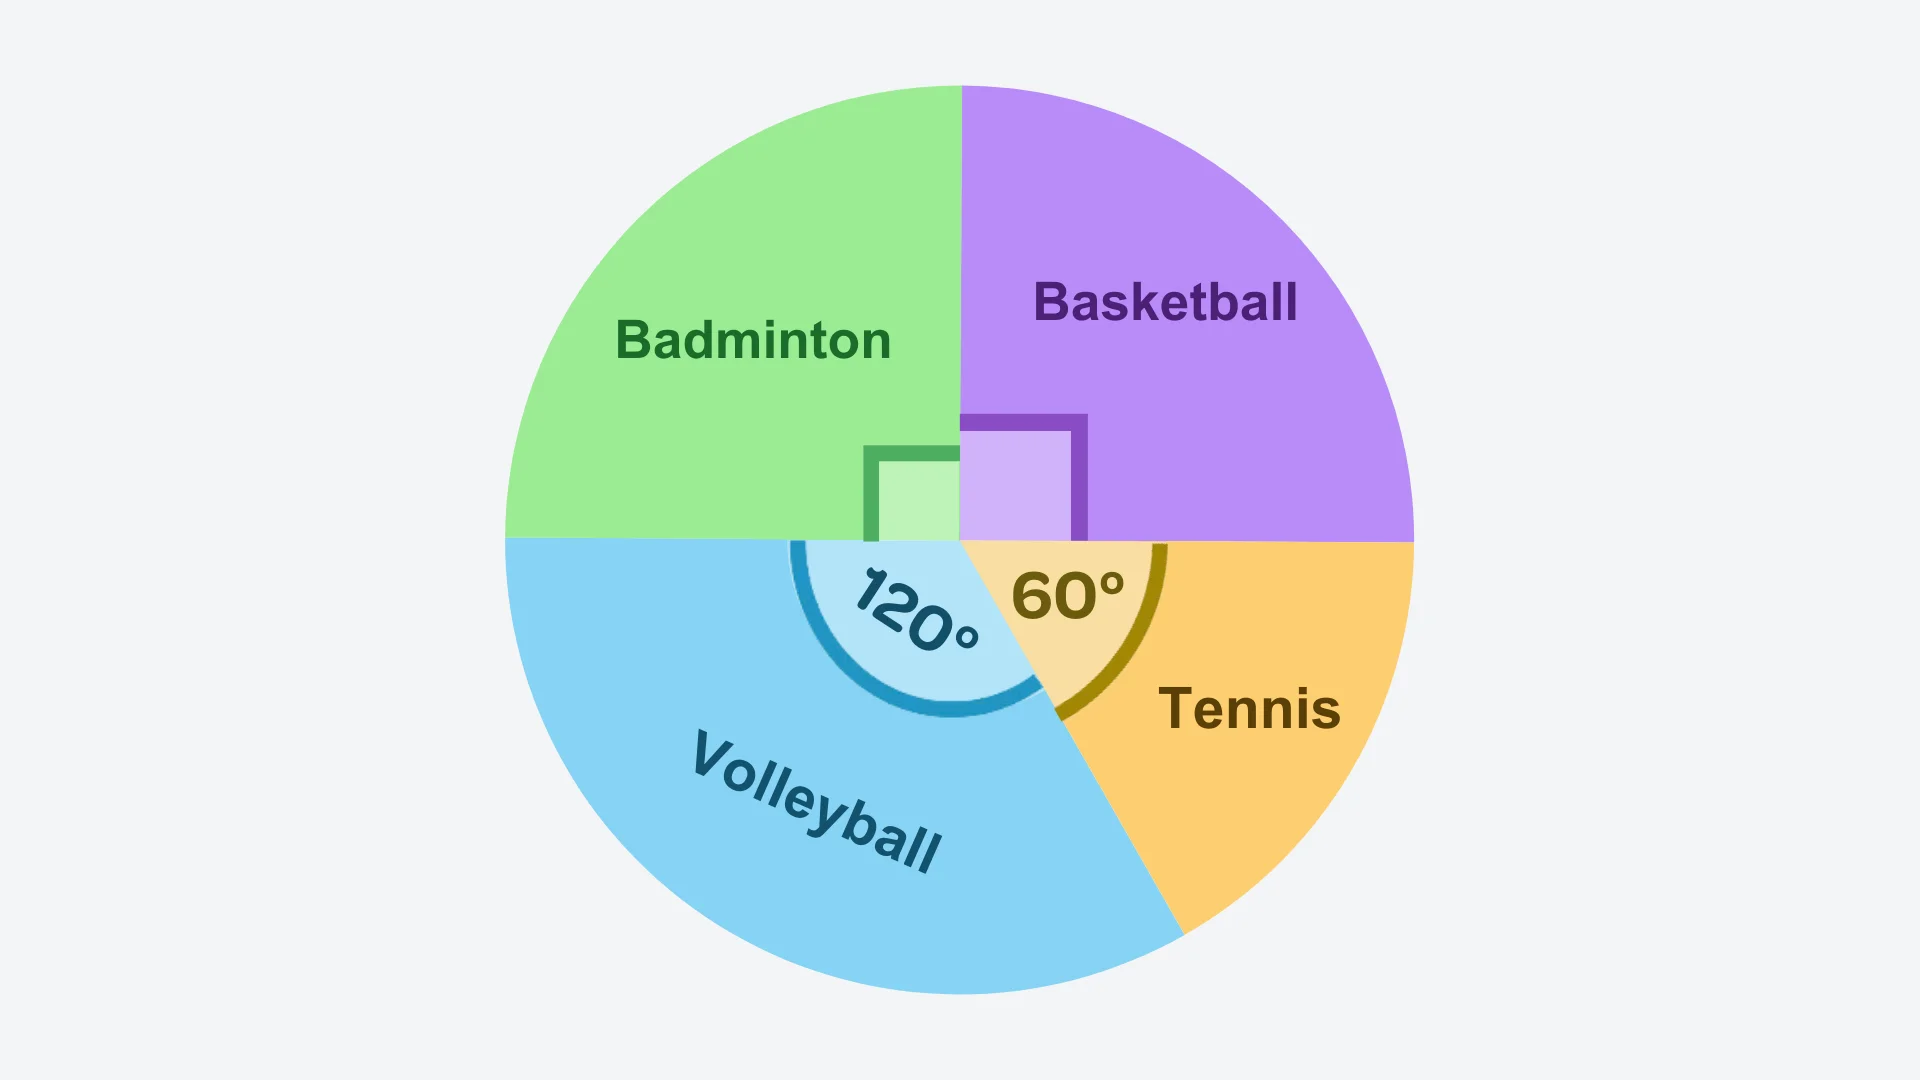
A pie chart shows the favourite sports of students at a school. If 60 students prefer Basketball, how many students prefer Volleyball?
Correct! 🎉 +30 pointsNot quite right
Basketball has a central angle of , so . If corresponds to 60 students, the total is . Volleyball has a central angle of , which is of the circle. students.
Want to see the full working?
Interactive Activity
Adjust the segments to see how a pie chart represents parts of a whole
Loading interactive widget...
Students Also Ask
The questions students bump into most on this topic
Divide the number of responses for that category by the total number of responses, then multiply by 360 degrees. For example, 25 basketball responses out of 100 gives 25 ÷ 100 × 360 = 90 degrees. Repeat this for every category in your frequency table.
A pie chart fills a complete circle, and a complete circle measures 360 degrees. Once you have worked out every central angle, adding them together should give exactly 360 degrees. If your total is different, check your calculations again before you start drawing.
Use the formula: count equals the central angle divided by 360 degrees, multiplied by the total count. For a ham slice of 36 degrees with 80 students surveyed, 36 ÷ 360 × 80 gives 8 students. The same method works for any category once you know the total.
Subtract all the known central angles from 360 degrees, and the result is the missing slice's angle. This works because every slice in a pie chart adds up to 360 degrees. In the pizza example, subtracting the other angles leaves 72 degrees for the pineapple slice.
Divide the central angle by 360 degrees. For instance, a pineapple slice of 72 degrees gives 72 ÷ 360 = 20%, so 20% of the group prefers pineapple. This turns any slice angle into the percentage of the total that the category represents.
You use a pie chart to compare the categories that make up a whole. Because each slice shows a category's share of the total, a pie chart makes it easy to see at a glance which parts take up larger or smaller proportions.