Median, Mean, Mode and Range from a Frequency Table
A frequency table shows how often each value appears. To find the mean, multiply each value by its frequency, add the results, then divide by the total frequency. The mode is the value with the highest frequency, and the median sits at position (n + 1) ÷ 2.
Video Lesson
Watch and learn the basics
🎬 Did this video explain it clearly?
Flashcards
Review key concepts visually
%20Mean%20from%20a%20frequency%20table.webp)
%20Median%20from%20a%20frequency%20table.webp)
%20Mode%20and%20Range%20from%20a%20frequency%20table.webp)
%20Overview%20Mean%2C%20Median%2C%20Mode%2C%20Range%20from%20Frequency%20Table.webp)
Mean from a Frequency Table
- Multiply each value by its frequency and add the results.
- Divide by the total frequency to find the mean.
Median from a Frequency Table
- Add the frequencies to find the total number of values (n).
- Use (n + 1) ÷ 2 to find the median position.
- Example: if , , so the 8th value is the median.
Range from a Frequency Table
- The range is the largest value minus the smallest value.
- Exam tip: do not use frequencies, only use the values.
Mode from a Frequency Table
- The mode is the value that appears the most often.
- It is the value with the highest frequency.
Practice Questions
Test your understanding
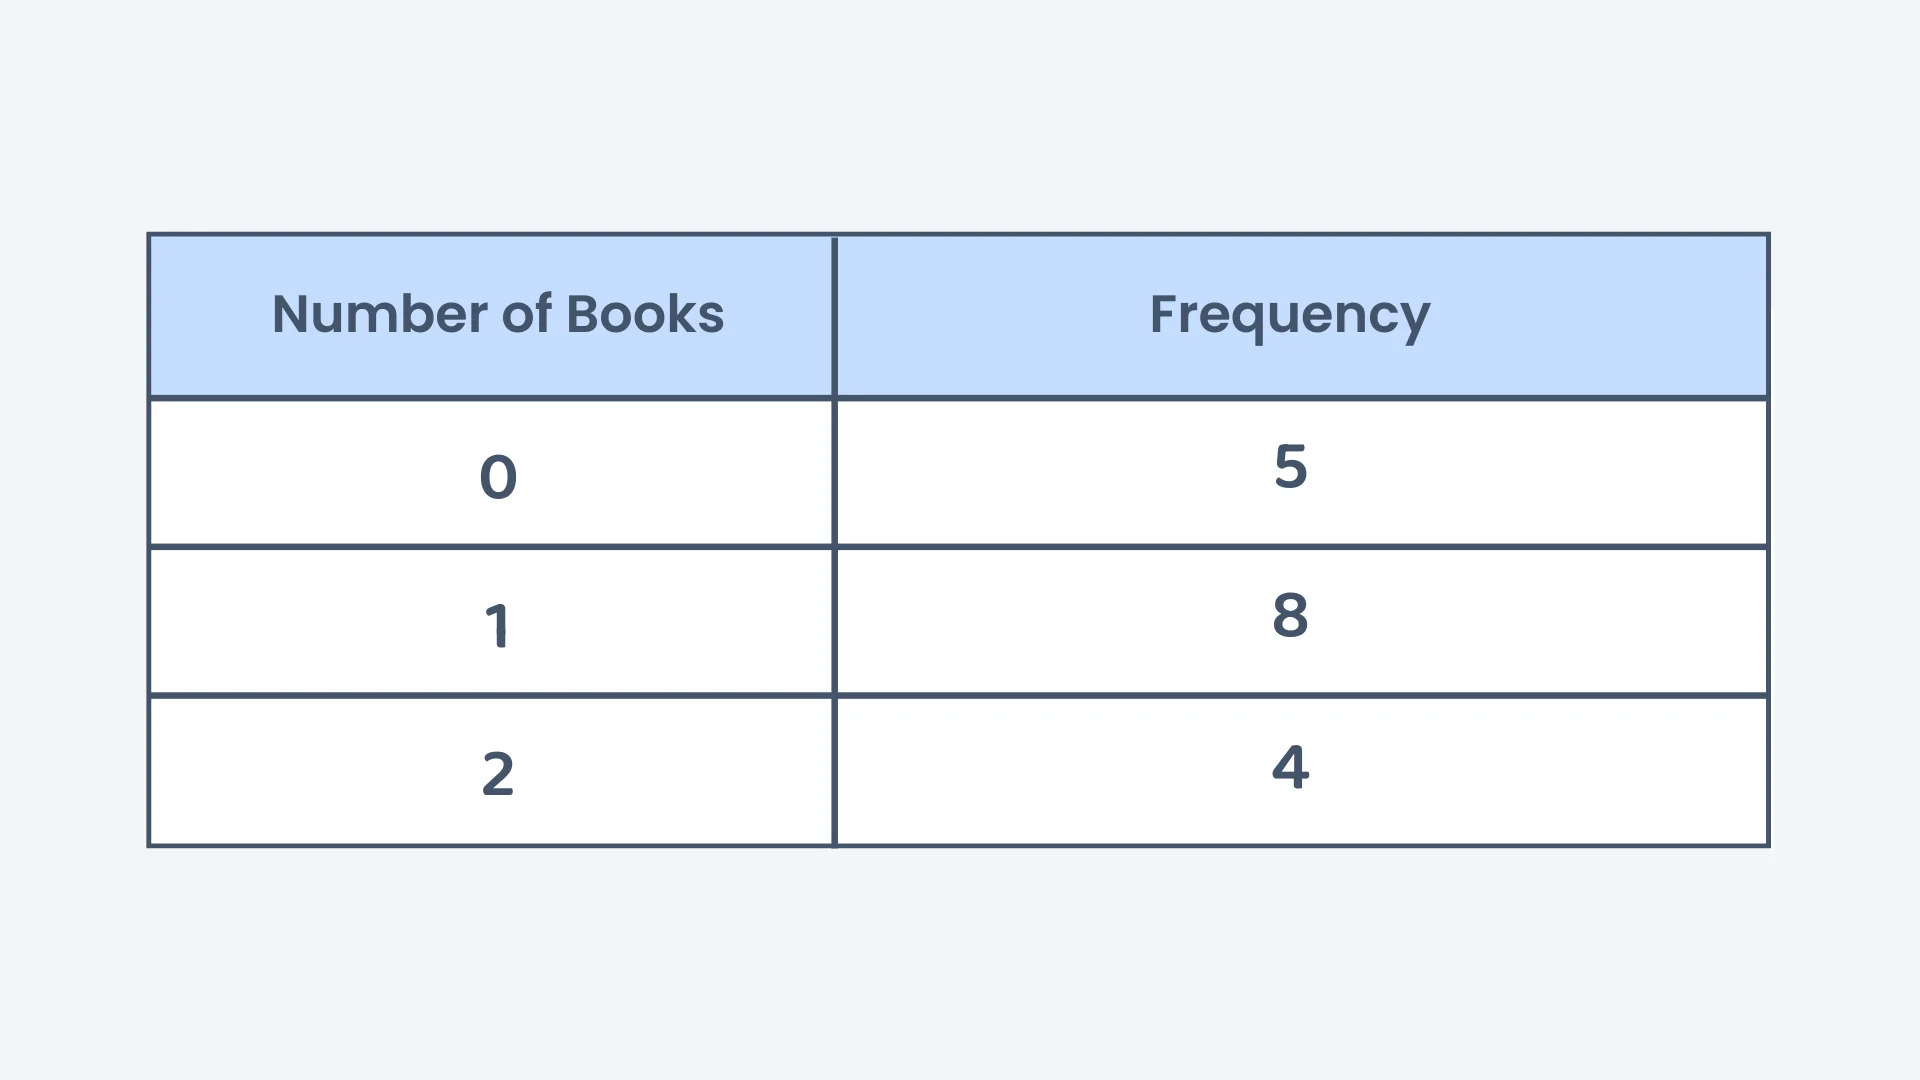
The frequency table below shows the number of books read by students. What is the mode of the data?
Correct! 🎉 +10 pointsNot quite right
The mode is the value that appears most frequently. Here, 1 appears 8 times, so the mode is 1.
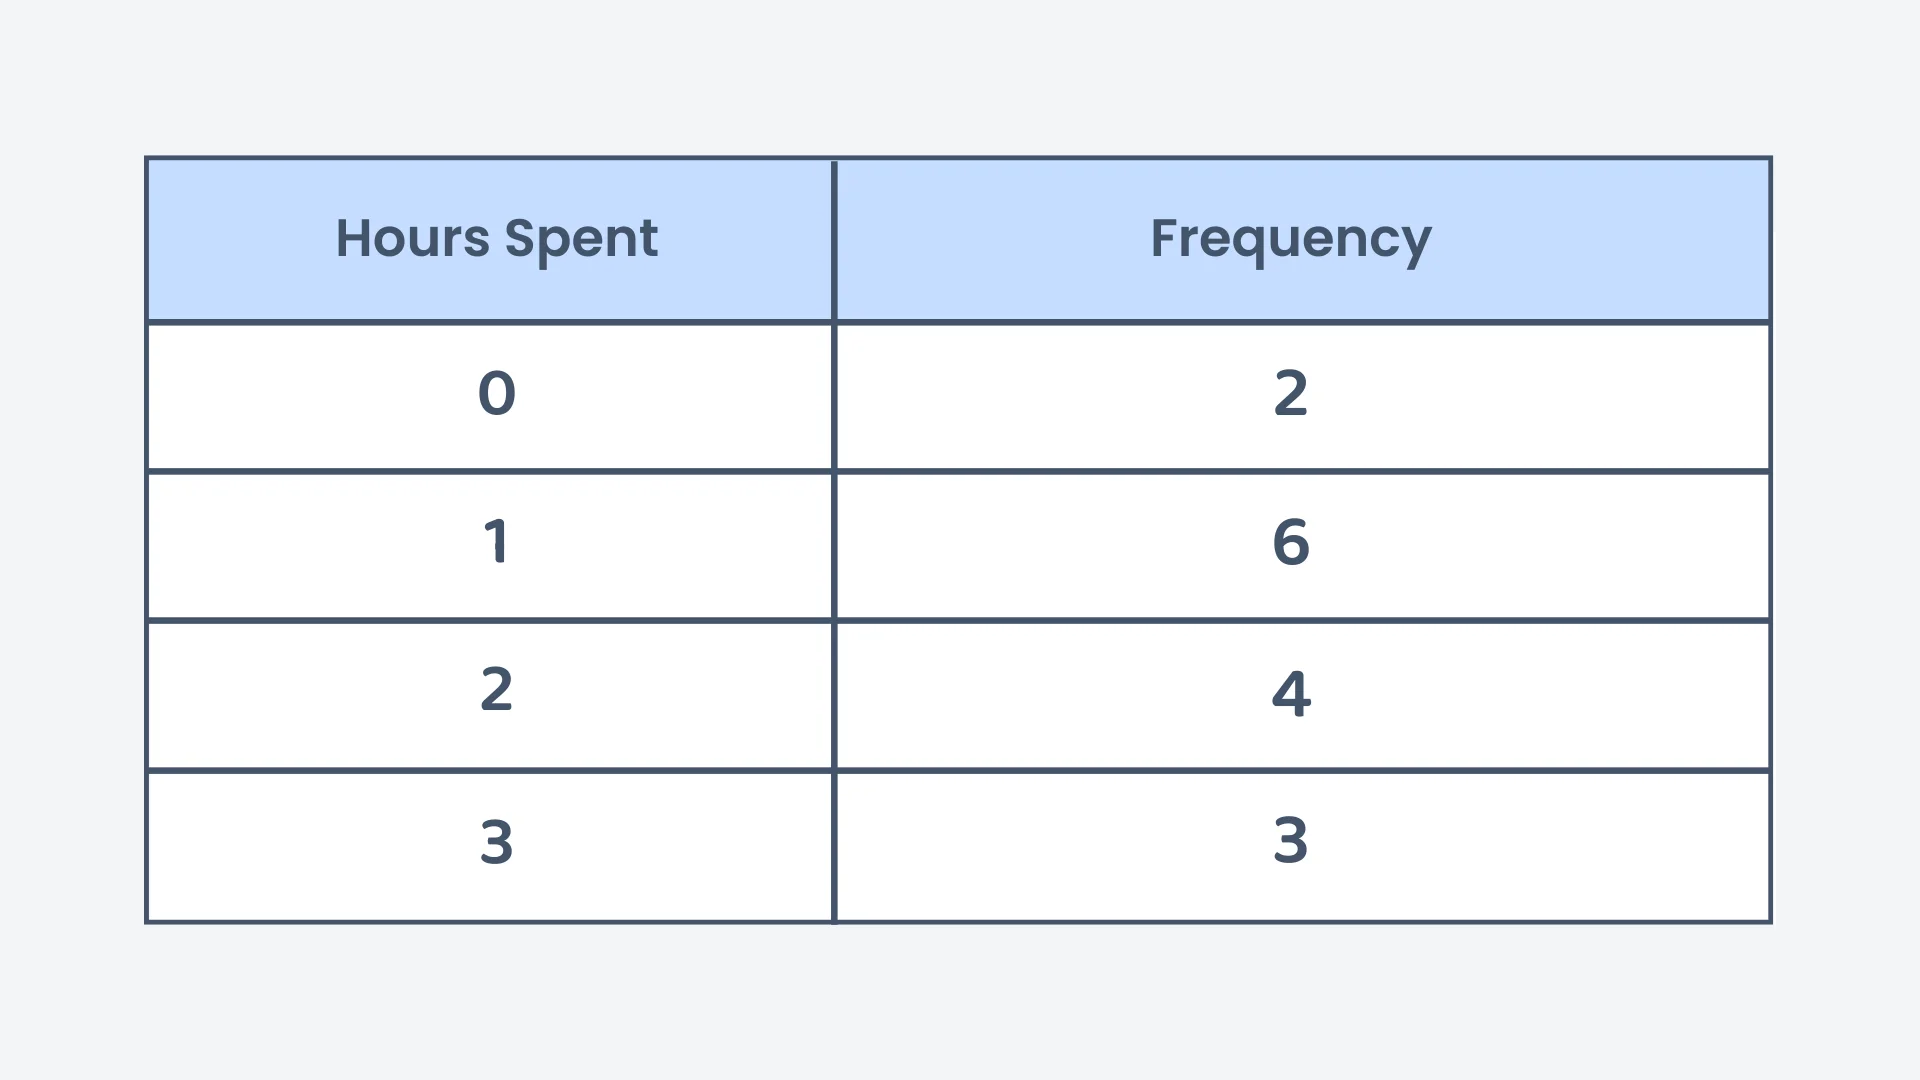
The table below shows the number of hours students spend on homework. What is the range of the data?
Correct! 🎉 +10 pointsNot quite right
The range is the difference between the maximum value (3) and the minimum value (0): .
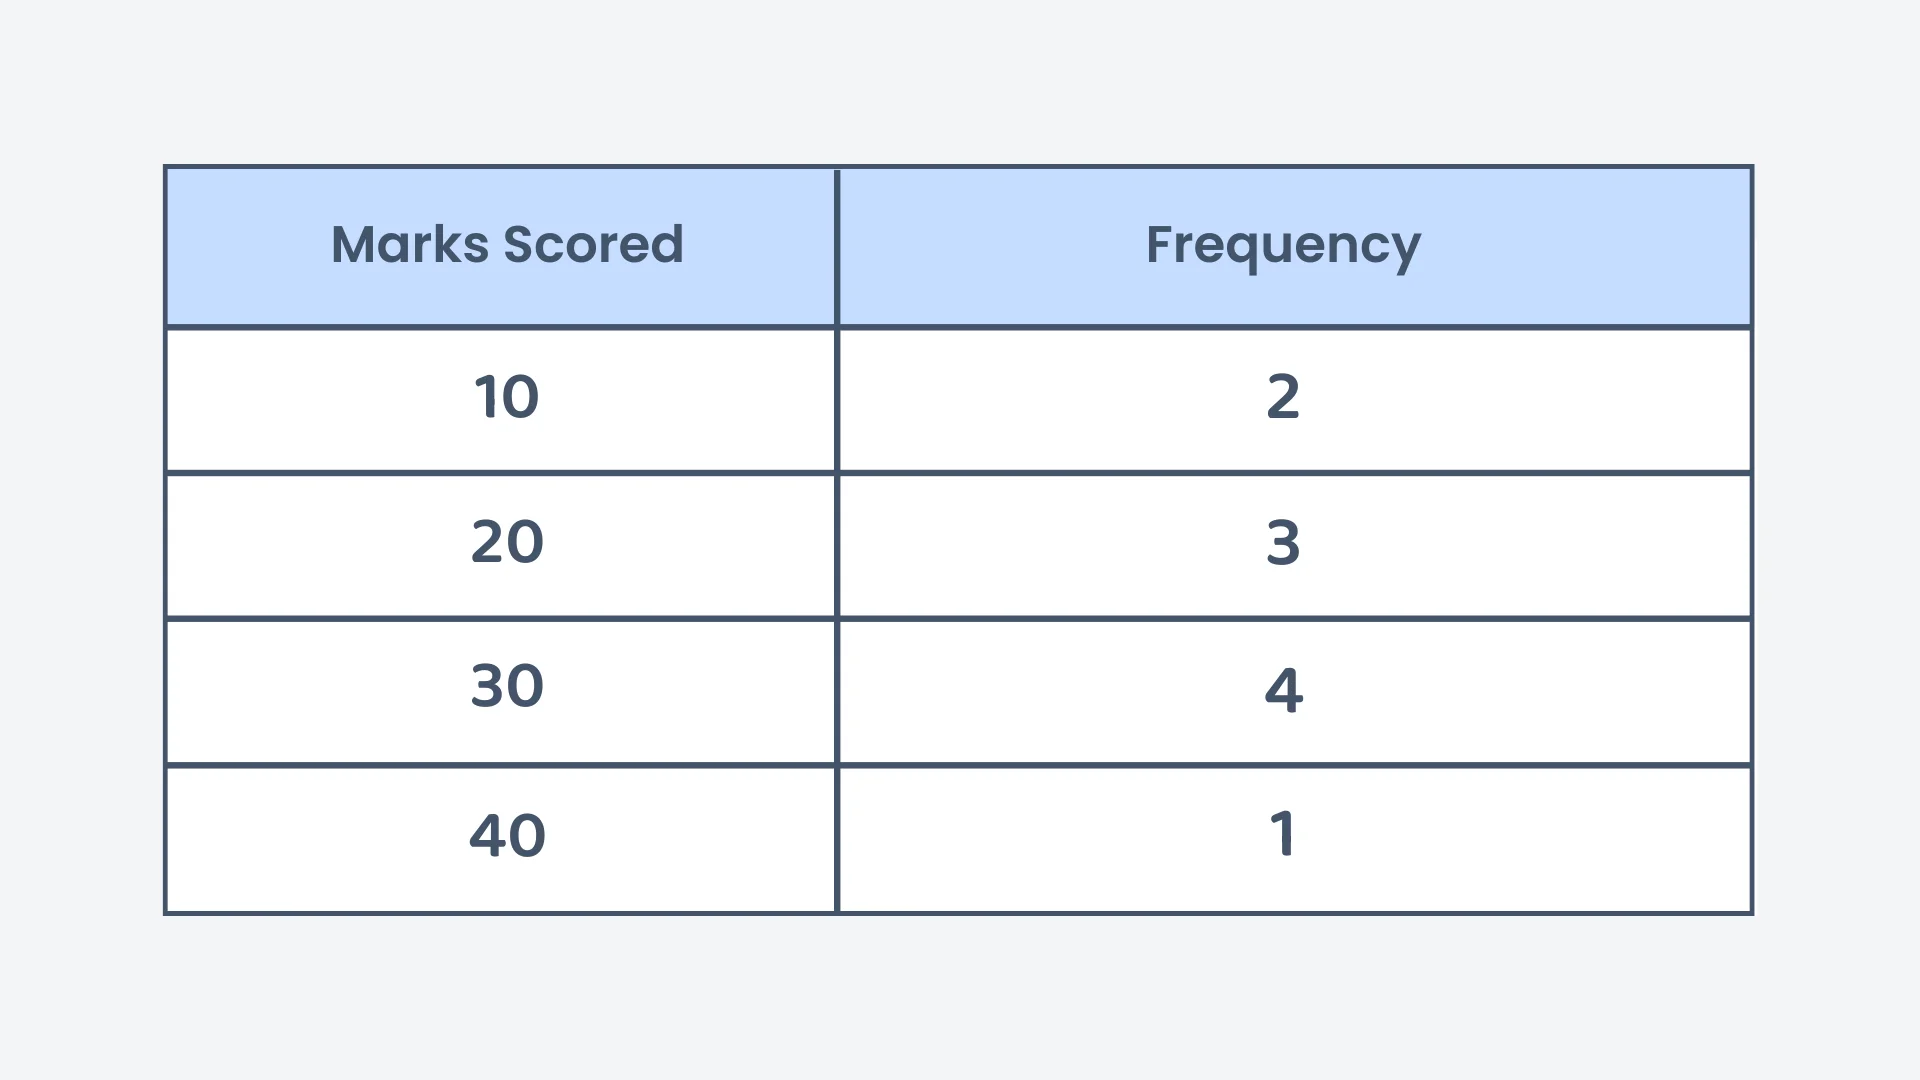
The table below shows the marks scored by students in a quiz. What is the mean mark?
Correct! 🎉 +20 pointsNot quite right
Calculate the total marks: . Total frequency is . .
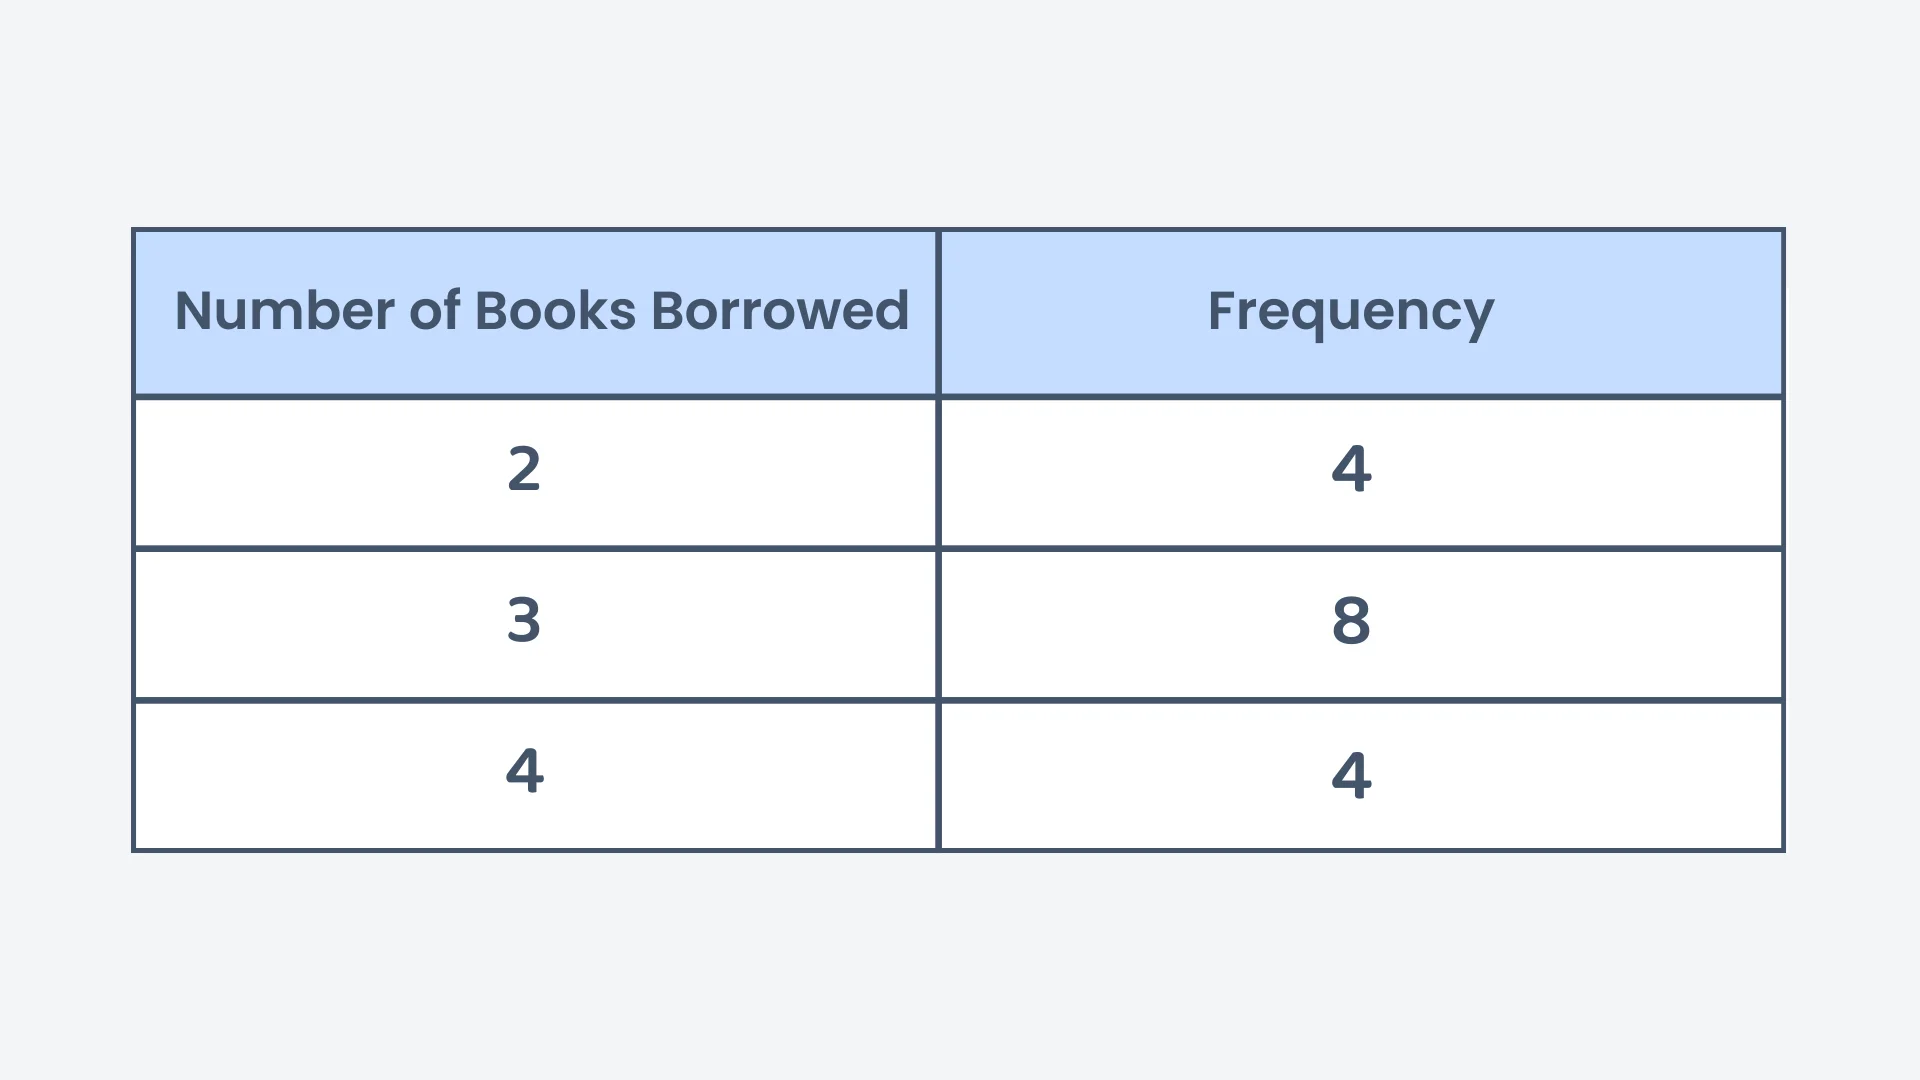
The table below shows the number of books borrowed by students from a library. What is the mean number of books borrowed?
Correct! 🎉 +20 pointsNot quite right
Calculate the total number of books borrowed: . Total frequency is . .
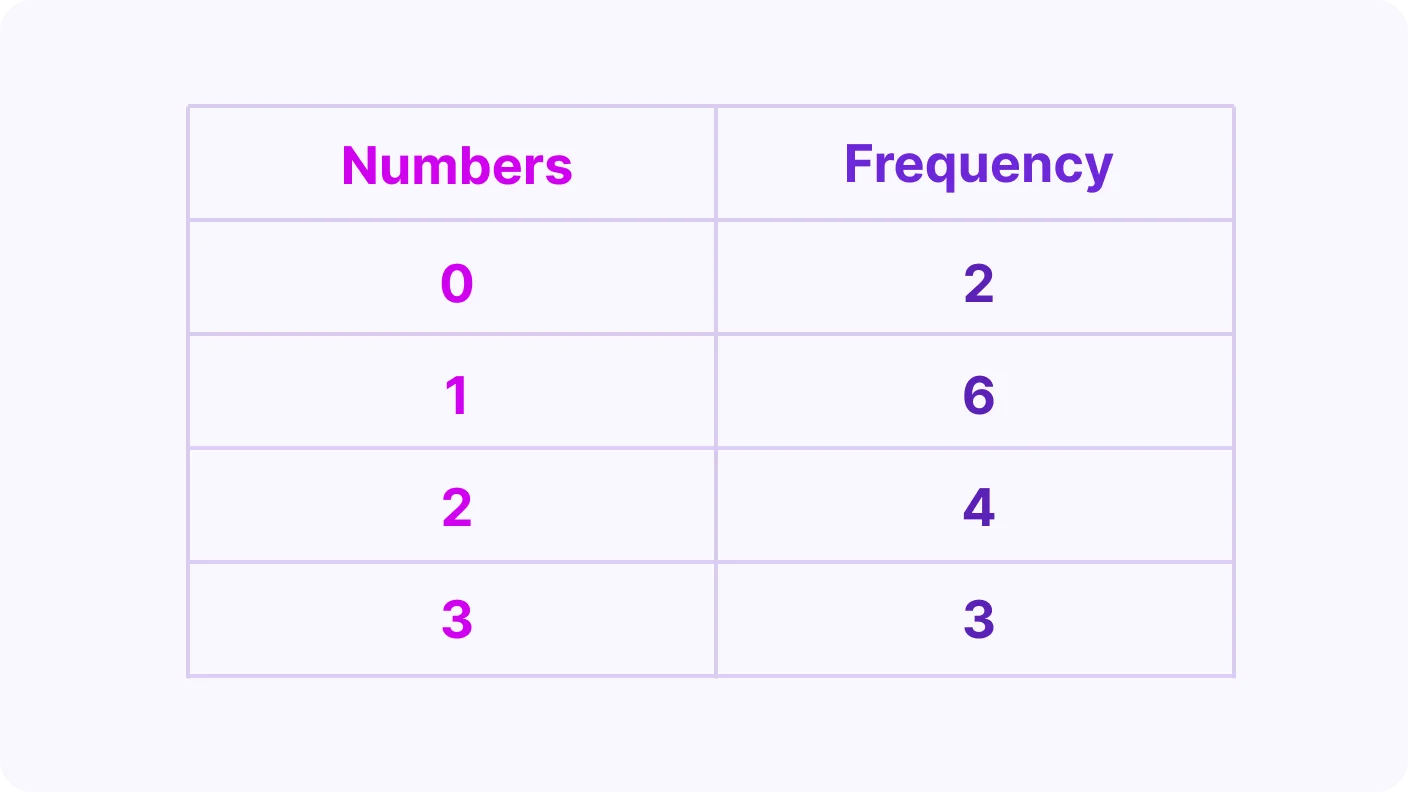
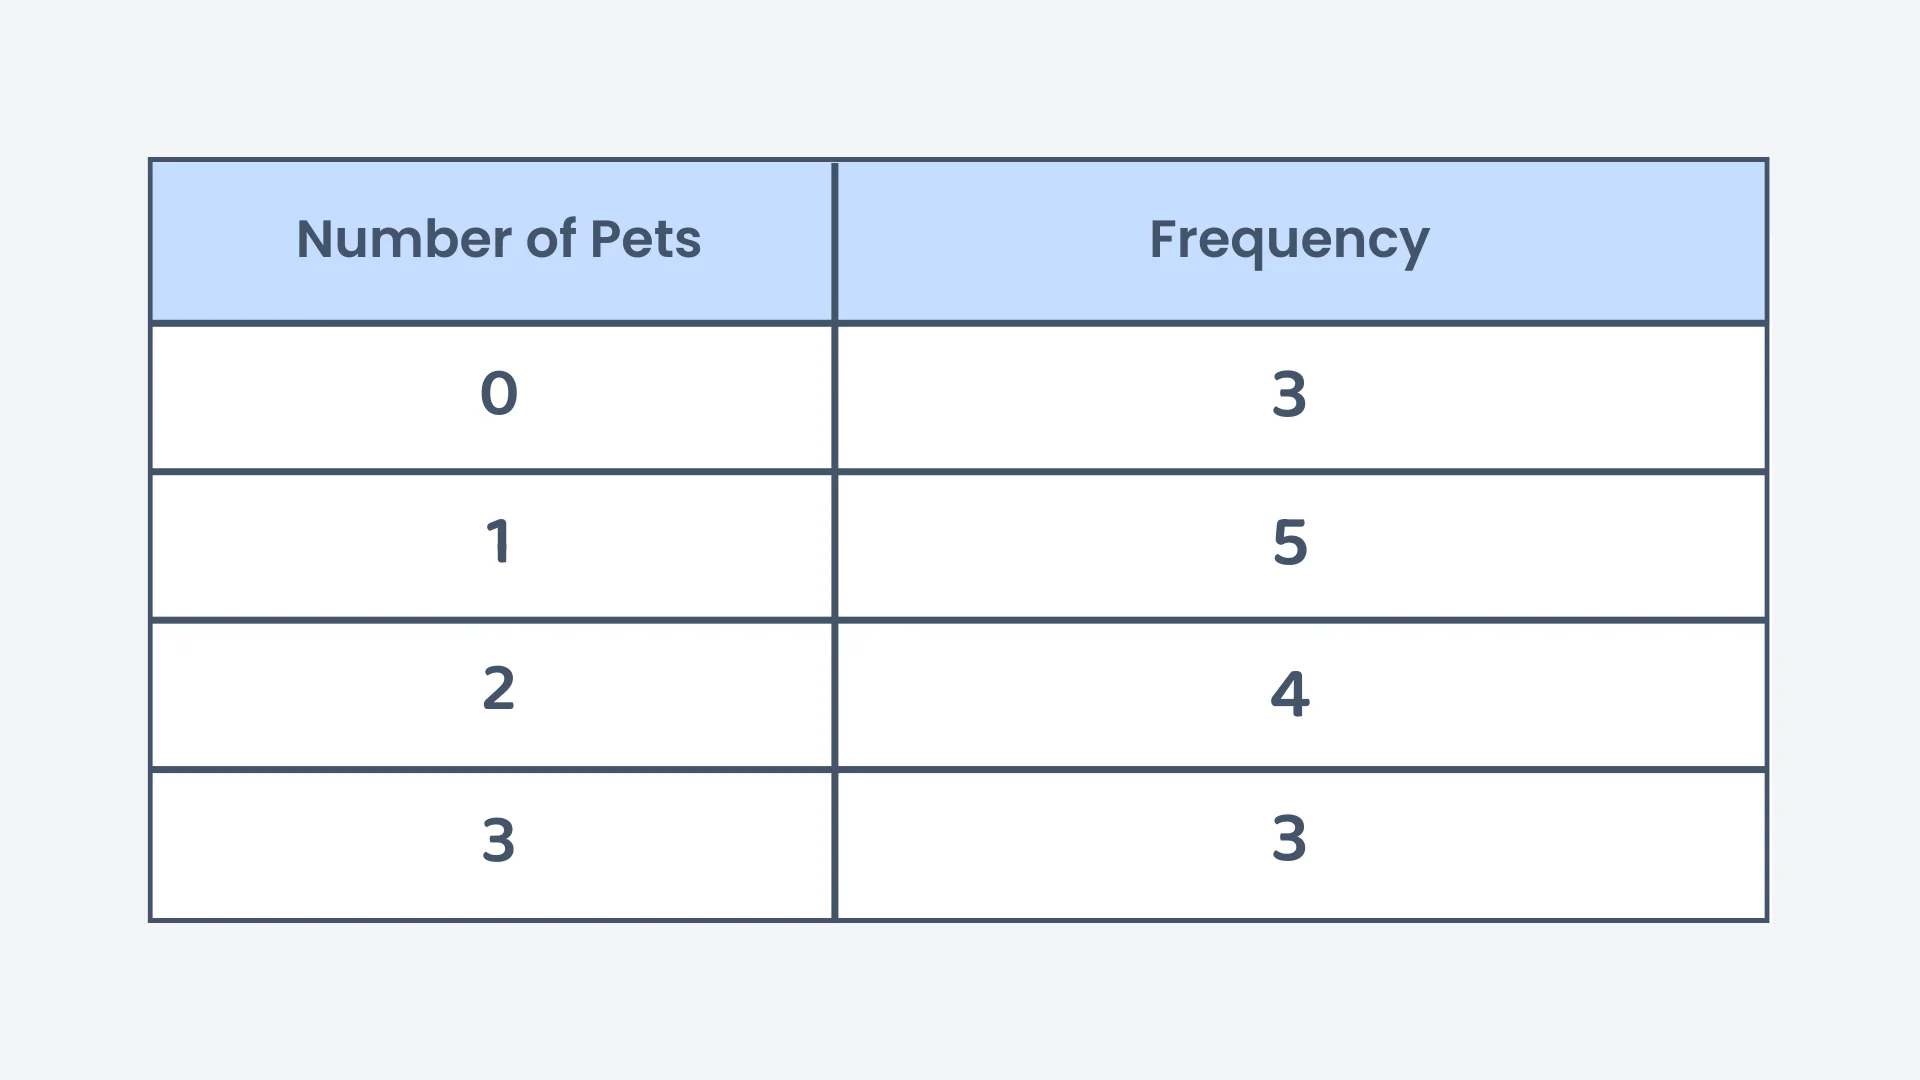
The table below shows the number of pets owned by students. What is the median of the data?
Correct! 🎉 +20 pointsNot quite right
The total number of students is . The median is the 8th value. The first 3 values are 0, the next 5 values are 1, so the 8th value is 1.
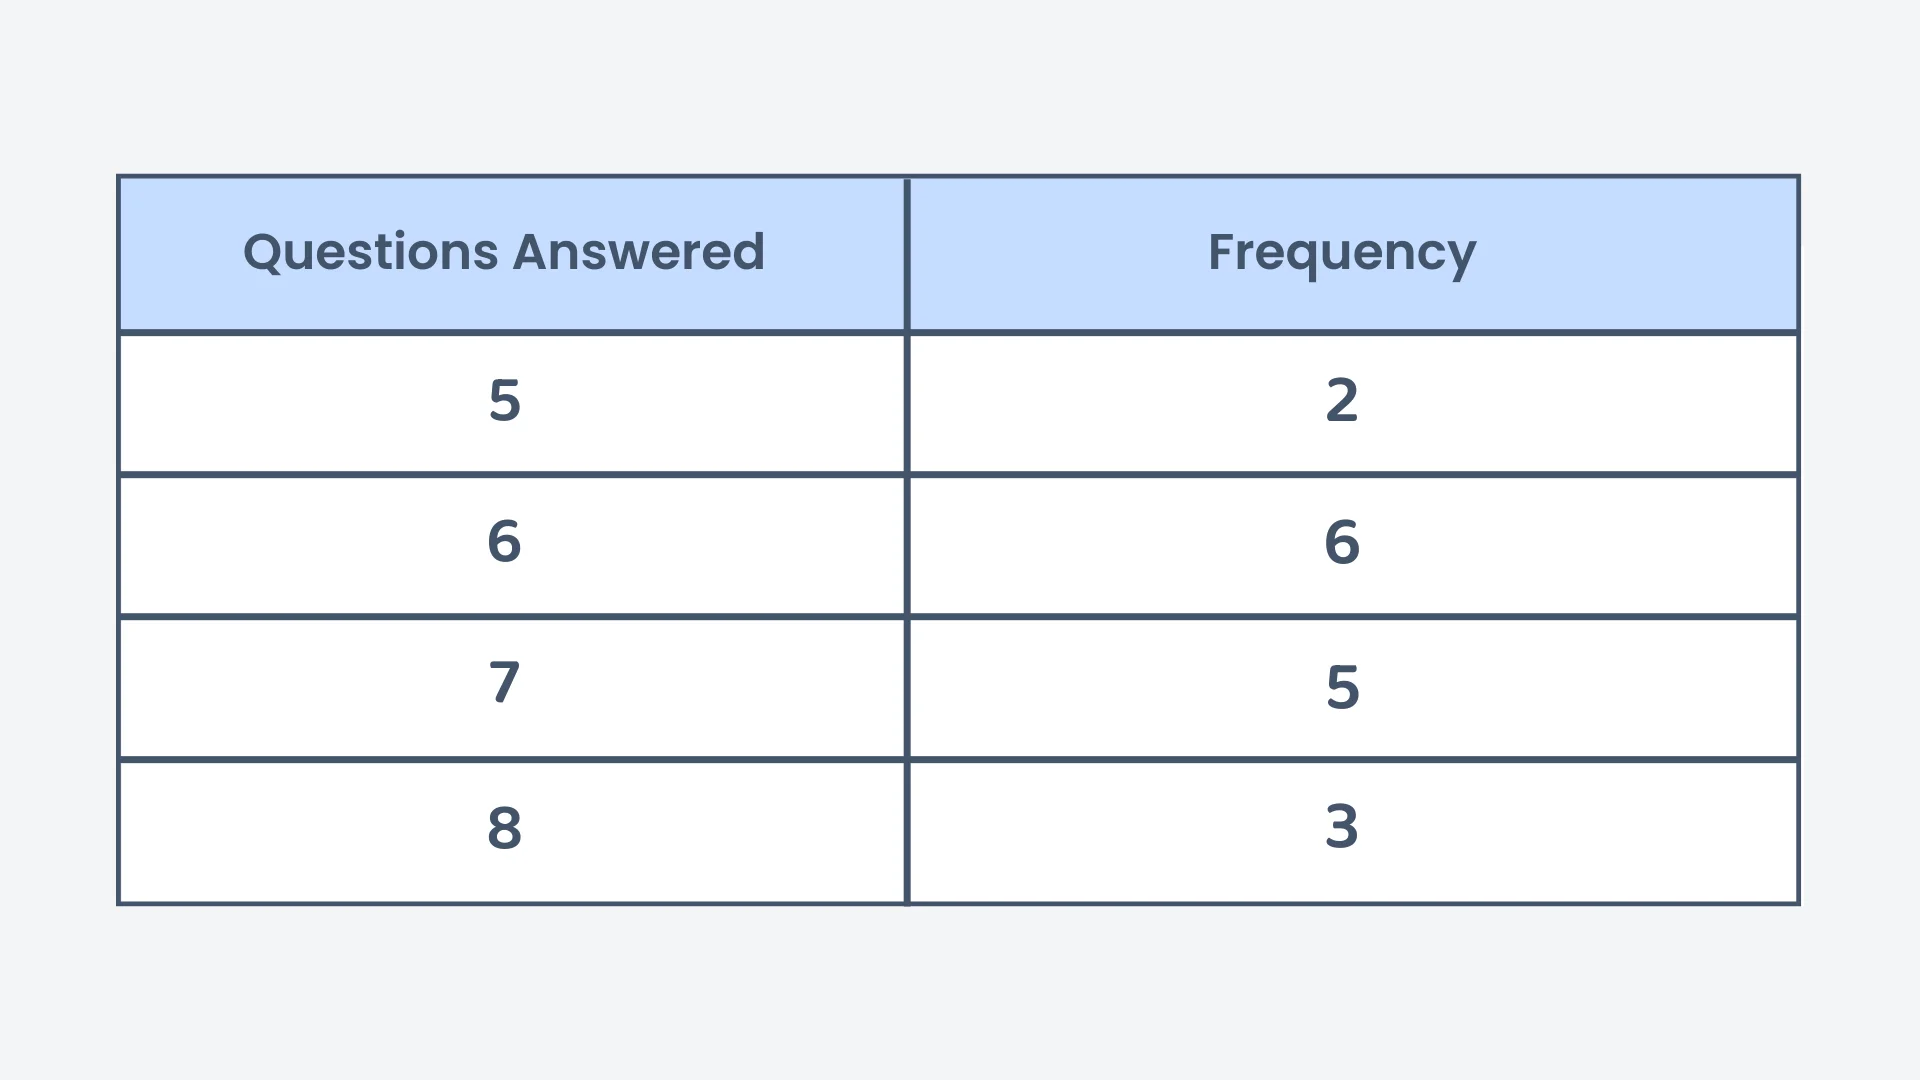
The table below shows the number of questions answered by students in a quiz. What is the median number of questions answered?
Correct! 🎉 +30 pointsNot quite right
First find the total frequency: . Since this is even, the median is the average of the 8th and 9th values. The 8th value is 6 and the 9th value is 7, so the median is .
Want to see the full working?
Interactive Activity
Explore Mean, Median, Mode & Range from a Frequency Table
Loading interactive widget...
Students Also Ask
The questions students bump into most on this topic
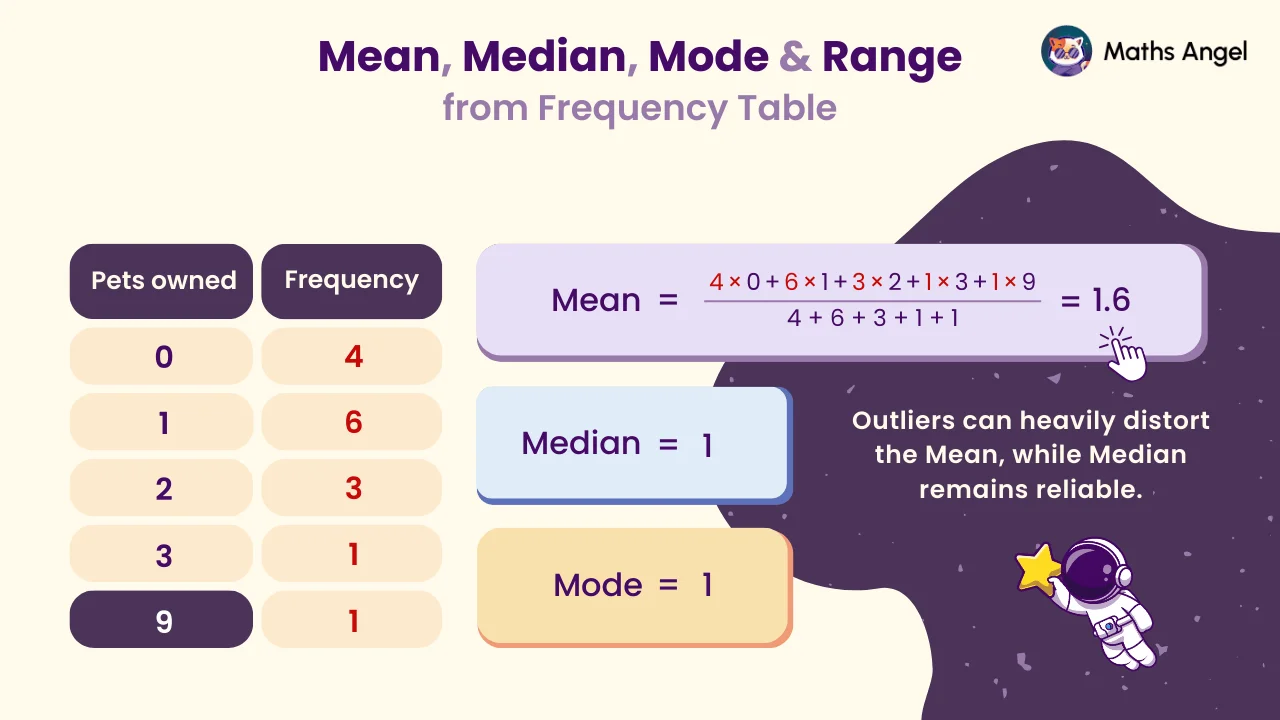
An outlier is a value far above or below the rest, and it pulls the mean towards itself. In the pets data the value 9 lifts the mean to 1.6, while the median stays at 1. The median barely moves, so it represents a skewed data set more reliably.
The formula gives the position of the median, not its value. Here N is the total number of values. With 15 values, (15 + 1) ÷ 2 equals 8, so the median is the 8th value once the data are sorted from smallest to largest.
Add up every number in the frequency column. In the pets table the frequencies 4, 6, 3, 1 and 1 add to 15, so 15 students were surveyed. This total tells you how many values there are, which you need for both the mean and the median.
The mean is the average, found by adding all the values and dividing by how many there are. The median is the middle value once the data are in order. They can differ: in the pets data the mean is 1.6 but the median is 1, because one large value lifts the mean.
The mode is the value that appears most often, so in a frequency table it is the value with the highest frequency. In the pets data, 1 pet has the highest frequency of 6, so the mode is 1. A frequency table makes the mode quick to spot.