Averages from a Grouped Frequency Table
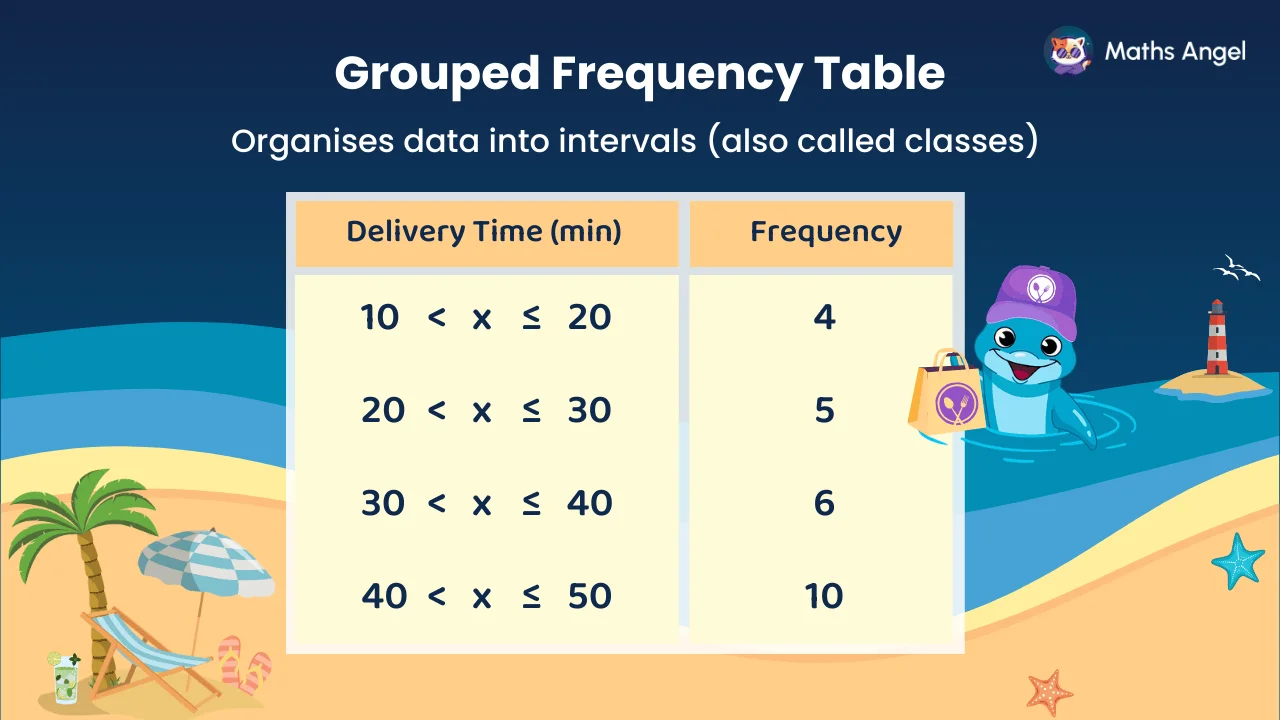
A grouped frequency table sorts data into class intervals and lists their frequencies. A frequency of 8 for 20-30 means 8 values fall in that range. From it you find the modal class, median class, and estimate the mean.
Video Lesson
Watch and learn the basics
🎬 Did this video explain it clearly?
Flashcards
Review key concepts visually
%20Grouped%20Frequency%20Table.webp)
%20Modal%20Class.webp)
%20Median%20from%20a%20Grouped%20Frequency%20Table.webp)
%20Mean%20from%20a%20Grouped%20Frequency%20Table.webp)
What Is a Grouped Frequency Table?
- A grouped frequency table organises data into class intervals.
- Each class shows how many values fall within that interval.
How to Find the Modal Class?
- The modal class is the class with the highest frequency.
- It shows where the data occurs most often.
How to Find the Median Class?
- Add the frequencies to find the total number of values (n).
- Use (n + 1) ÷ 2 to find the median position.
- If , , so the class containing the 13th value is the median class.
How to Estimate the Mean?
- Find the midpoint of each class by adding the lower and upper values and dividing by 2.
- Multiply each midpoint by its frequency and add the results.
- Divide this sum by the total frequency to estimate the mean.
Practice Questions
Test your understanding
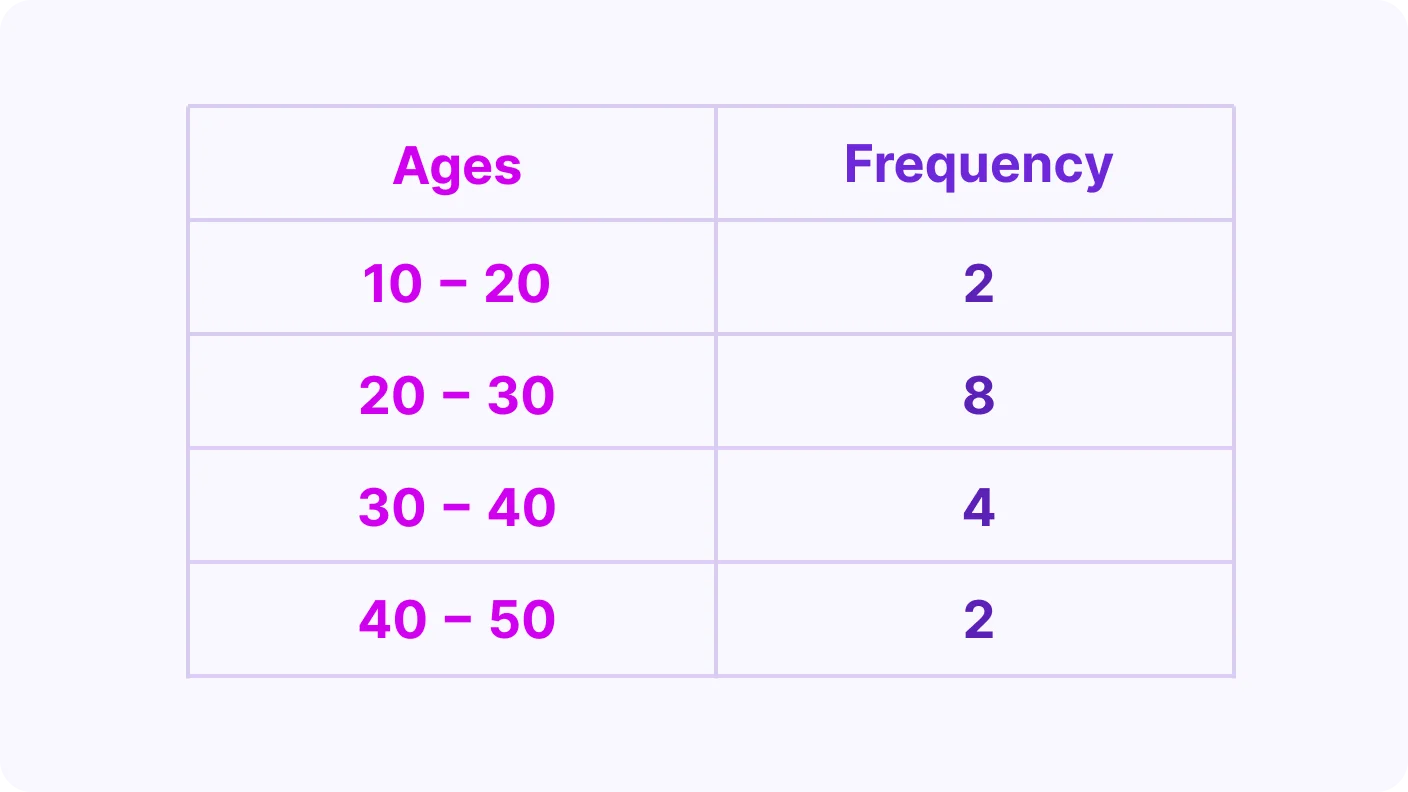
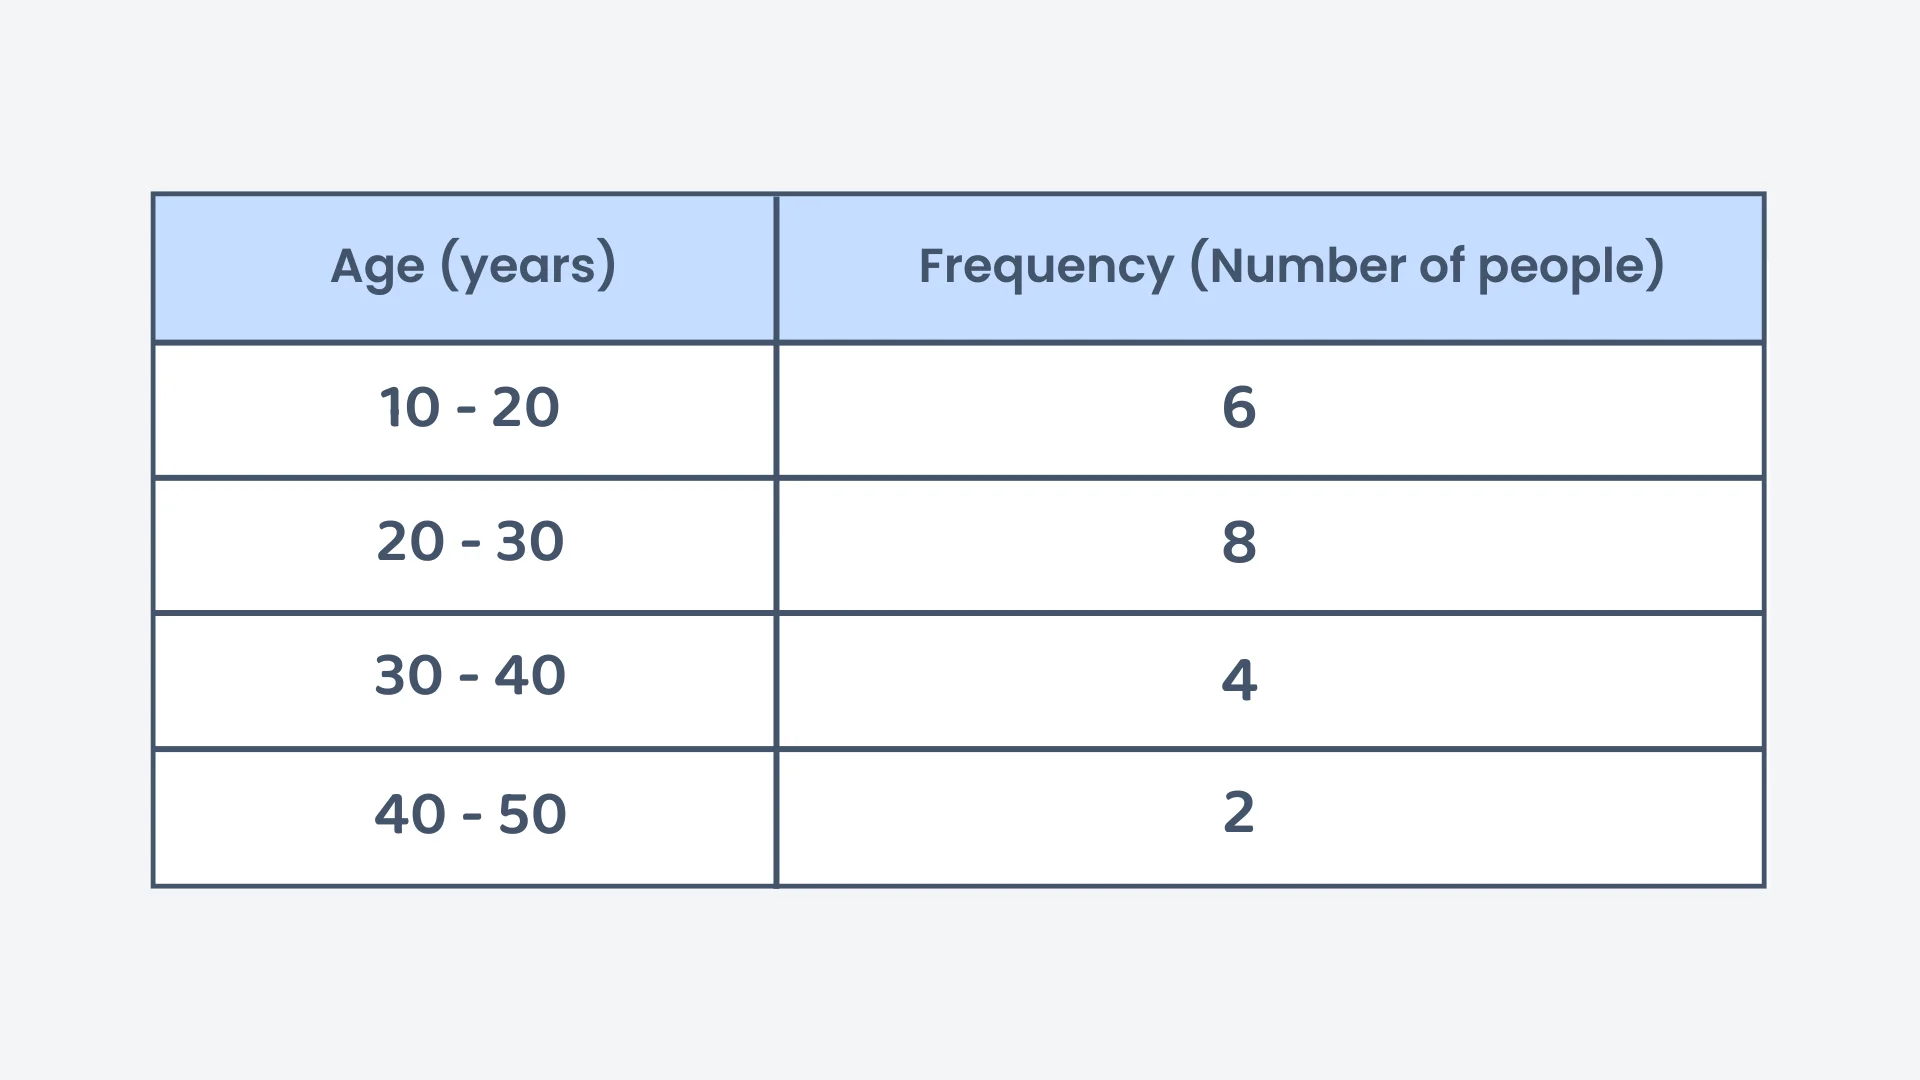
The table shows the ages of people attending a concert. How many people are represented in total?
Correct! 🎉 +10 pointsNot quite right
Add all the frequencies: people attended the concert.
The table shows the ages of people attending a concert. What is the modal class for the data?
Correct! 🎉 +10 pointsNot quite right
The modal class is the age group with the highest frequency. Here, 20-30 years has the highest frequency of 8 people.
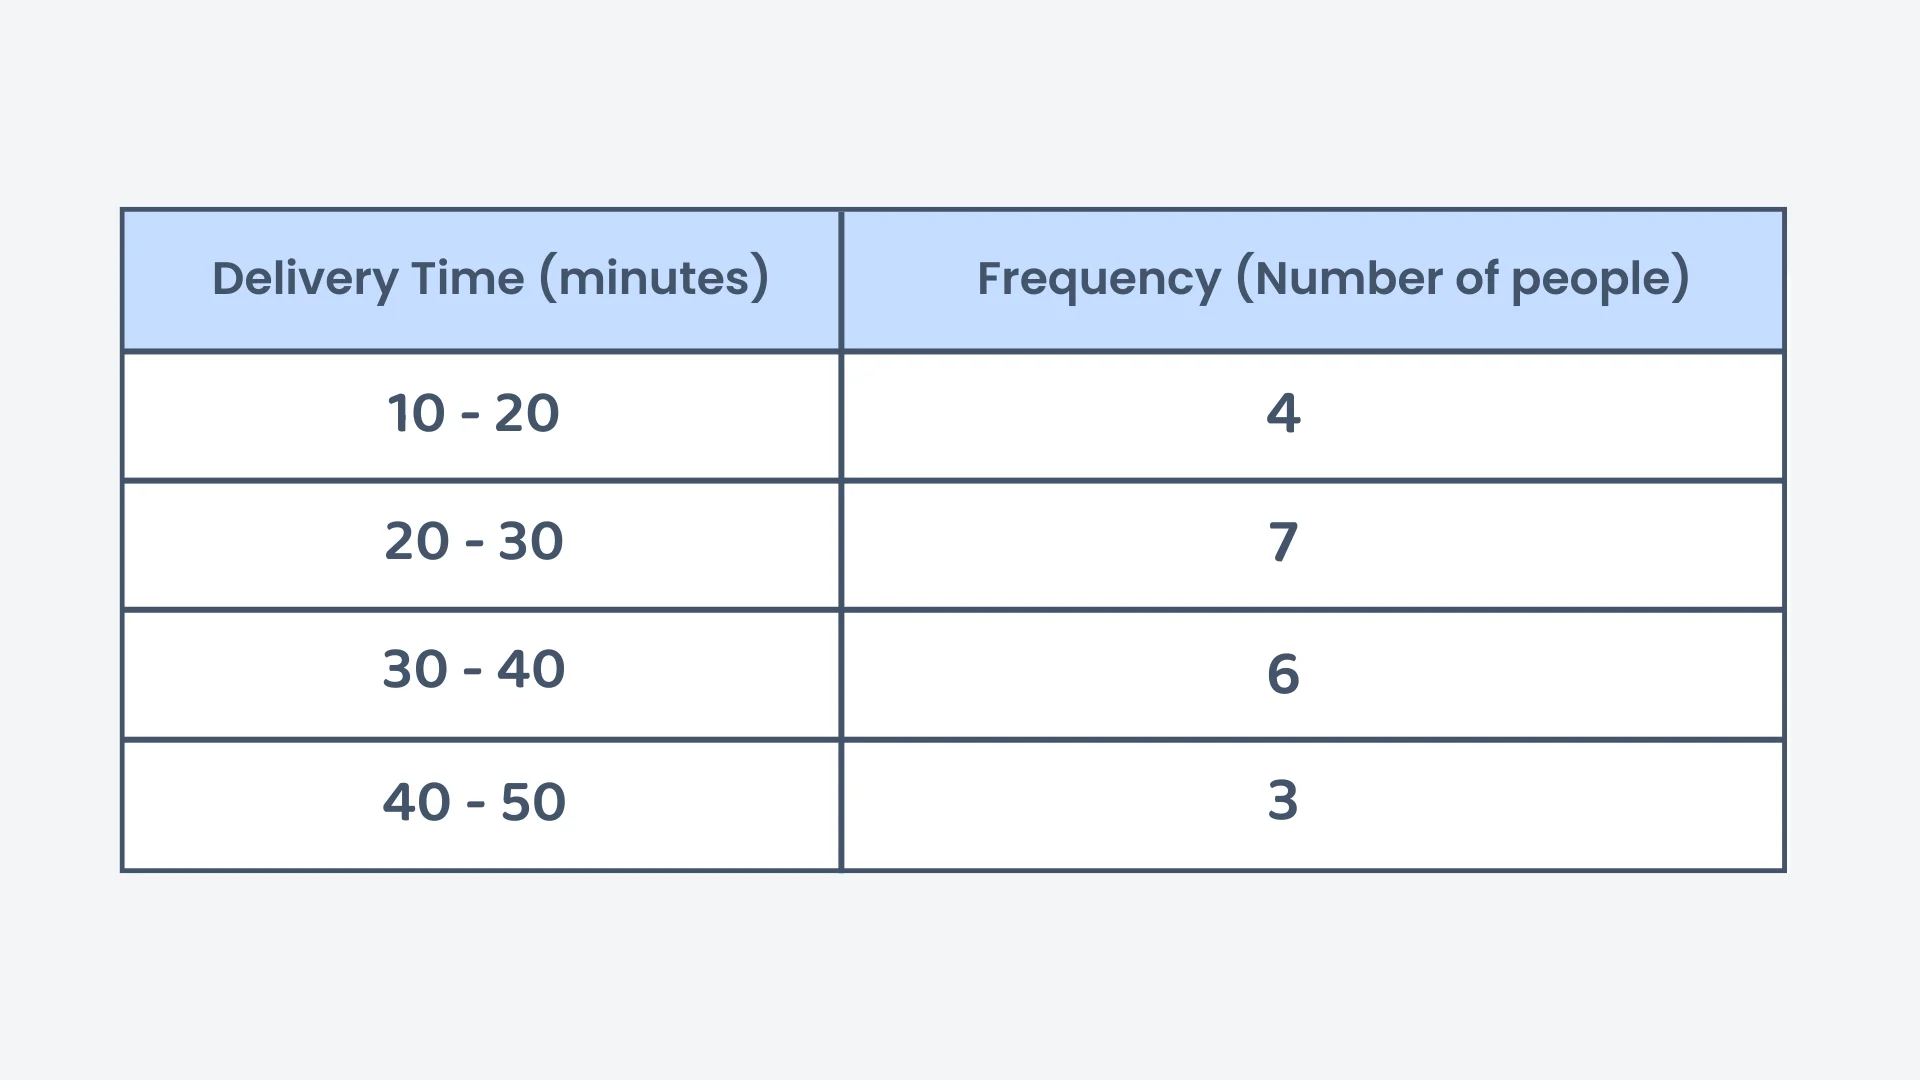
The table below shows the delivery times for a courier service. Which class contains the median delivery time?
Correct! 🎉 +20 pointsNot quite right
First find the total frequency: . The median lies between the 10th and 11th values. Both of these fall in the 20-30 minute class, so this class contains the median delivery time.
What is the midpoint of the 20-30 minute interval?
Correct! 🎉 +20 pointsNot quite right
The midpoint of the 20-30 minute interval is calculated as .
If 2 more orders are added to the 30-40 minutes range, how will this affect the modal class?
Correct! 🎉 +20 pointsNot quite right
By adding 2 more orders to the 30-40 range, its frequency increases to 8, making it the highest frequency. The modal class becomes 30-40 minutes.
Using the table below, estimate the mean delivery time.
Correct! 🎉 +30 pointsNot quite right
Multiply each midpoint by its frequency: . Then divide by the total frequency: minutes.
Want to see the full working?
Interactive Activity
Averages from grouped frequency table
Loading interactive widget...
Students Also Ask
The questions students bump into most on this topic
Each row shows a class interval and its frequency. The class interval is a range, such as 10 to 20 minutes. The frequency tells you how many values fall in that range. In the pizza example, a frequency of 4 means 4 deliveries took between 10 and 20 minutes.
Read the frequency column and find the largest frequency. The class interval next to that frequency is the modal class. In the pizza delivery table, the largest frequency is 10. It belongs to the 40 to 50 minutes interval, so that is the modal class.
A grouped frequency table only shows the class each value falls in, not the exact values. Because the exact data is unknown, you use the midpoint of each class to represent it. This gives an estimate of the mean rather than an exact answer.
The midpoint is the value halfway between the two ends of a class interval. For the 10 to 20 minutes class, the midpoint is 15. Midpoints are used to estimate the mean, because the exact values in each class are unknown.
Use the formula (n + 1) ÷ 2, where n is the total frequency. For the pizza table, n is 25. The median position is (25 + 1) ÷ 2 = 13, the 13th value. You then find which class interval contains that position.