Absolute Frequency and Relative Frequency
Absolute frequency is how often something happens. Relative frequency compares that count to the whole: count ÷ total. The relative frequencies always add up to 1, or 100%.
Video Lesson
Watch and learn the basics
🎬 Did this video explain it clearly?
Flashcards
Review key concepts visually
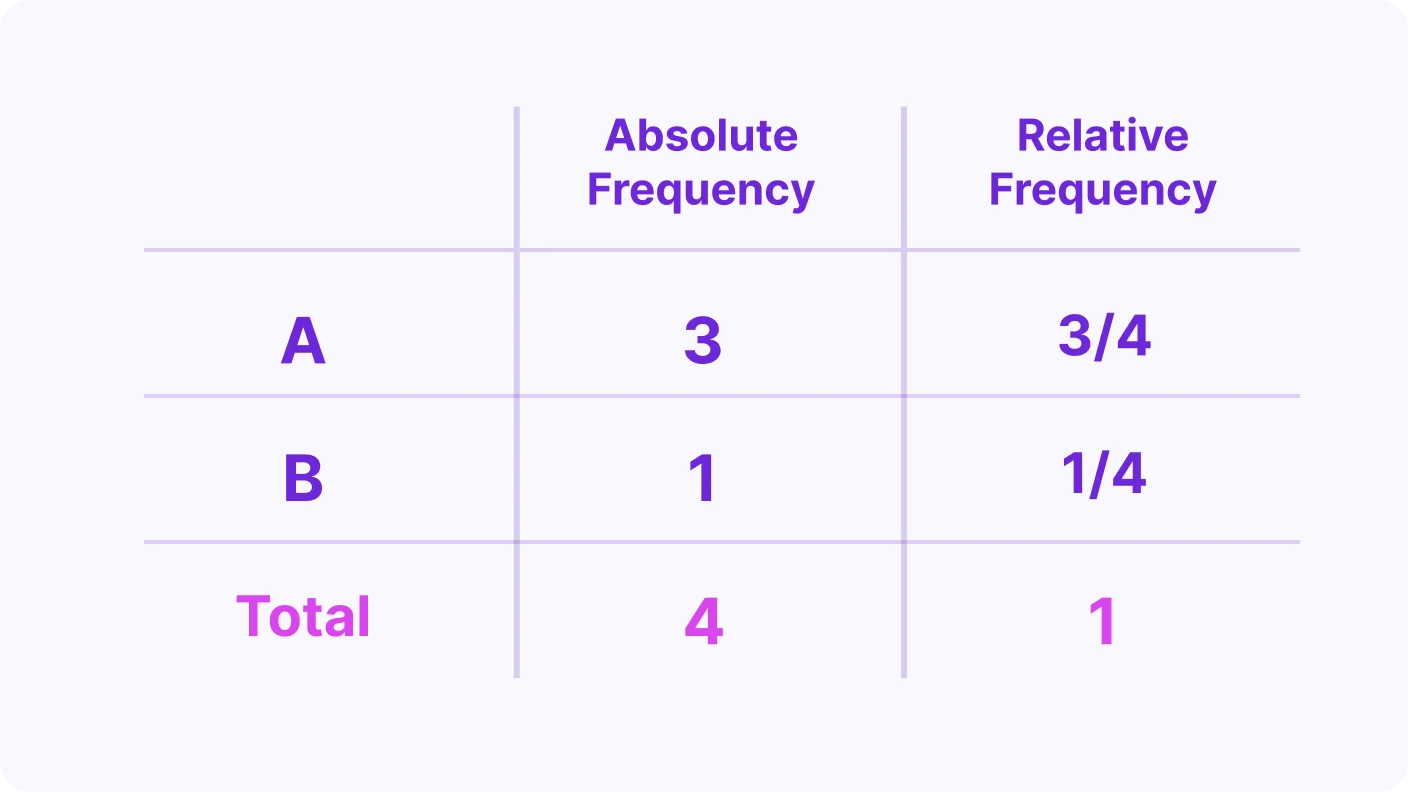
%20Absolute%20Frequency.webp)
%20Relative%20Frequency.webp)
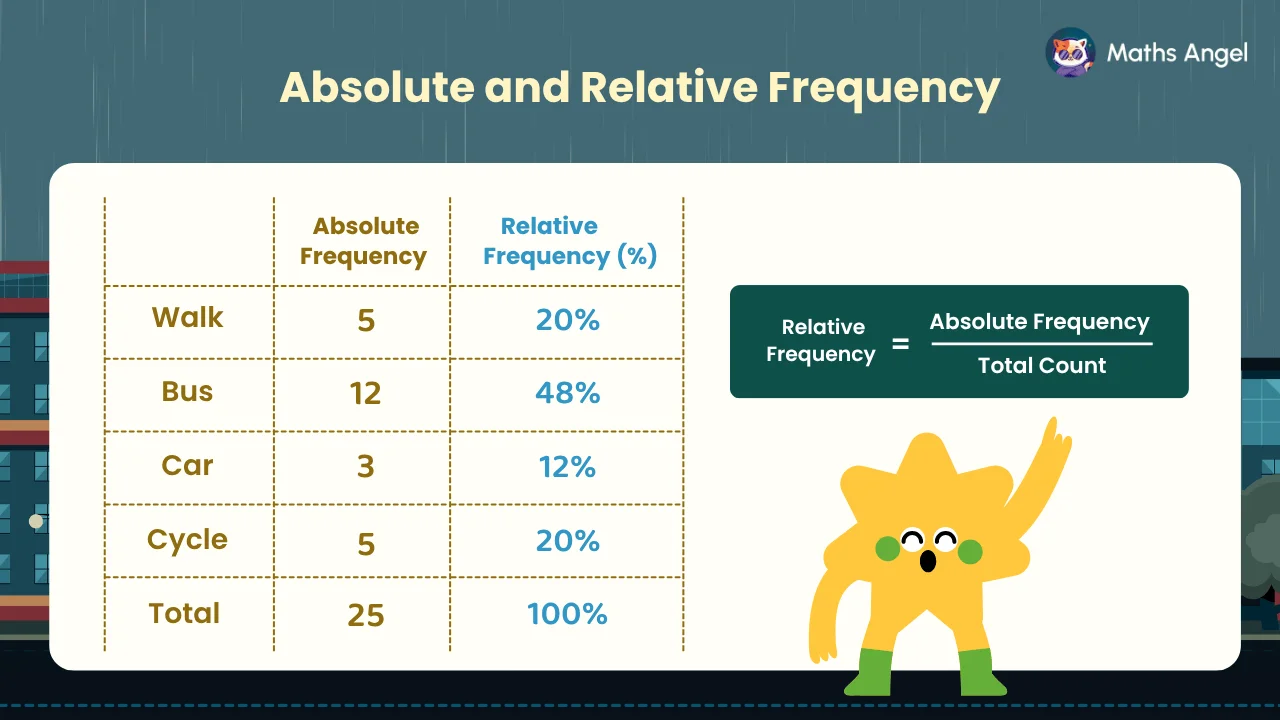
%20Absolute%20and%20Relative%20Frequency%20Relationship.webp)
What Is Absolute Frequency?
- It tells you the exact number of times something happens
- Adding all absolute frequencies gives the total number of data values
What Is Relative Frequency?
- It tells you how big each category is, as a fraction or percentage
- Adding all relative frequencies gives 1, or
How to Calculate Absolute and Relative Frequency?
- Relative frequency = absolute frequency of the category ÷ total number
- Absolute frequency = relative frequency of the category × total number
Practice Questions
Test your understanding
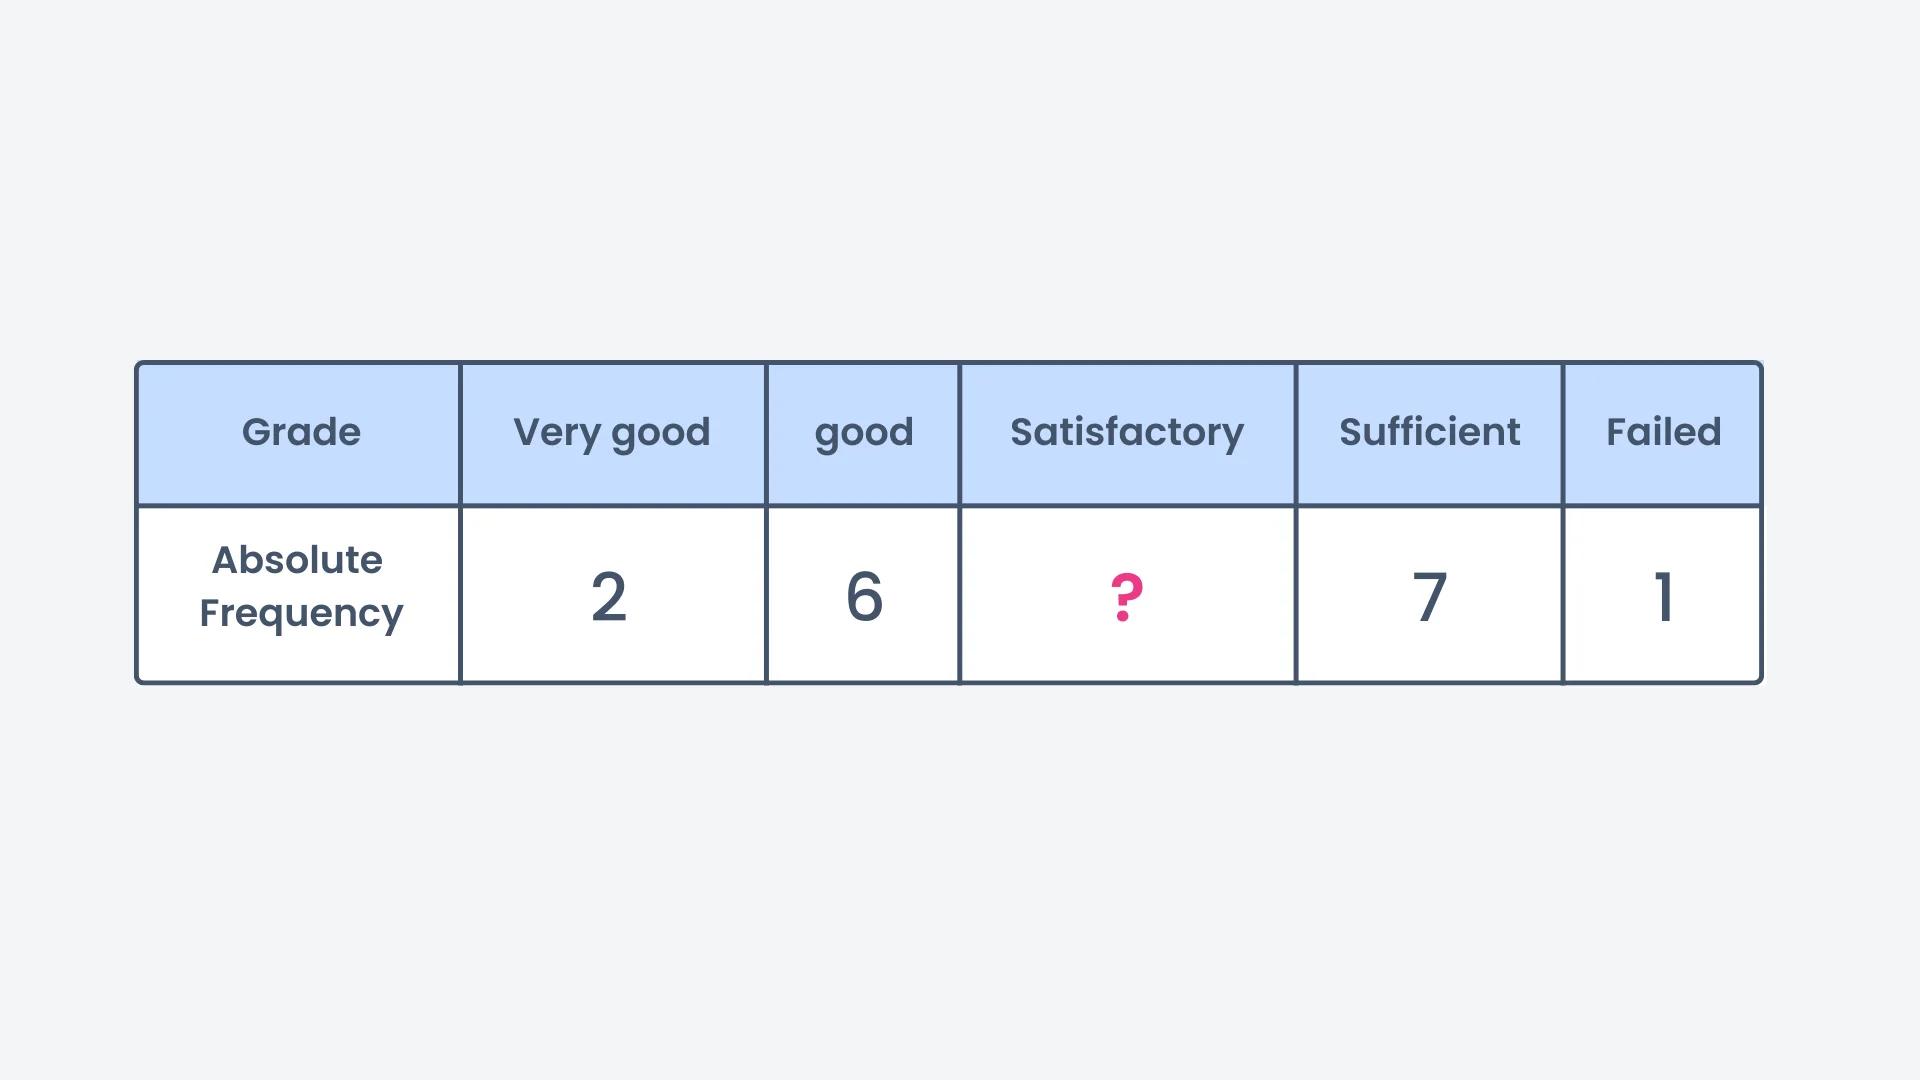
The frequency table below shows the grades achieved by 25 students. If the total number of students is 25, how many students obtained the grade Satisfactory?
Correct! 🎉 +10 pointsNot quite right
To find the missing absolute frequency, subtract the other values from the total: .
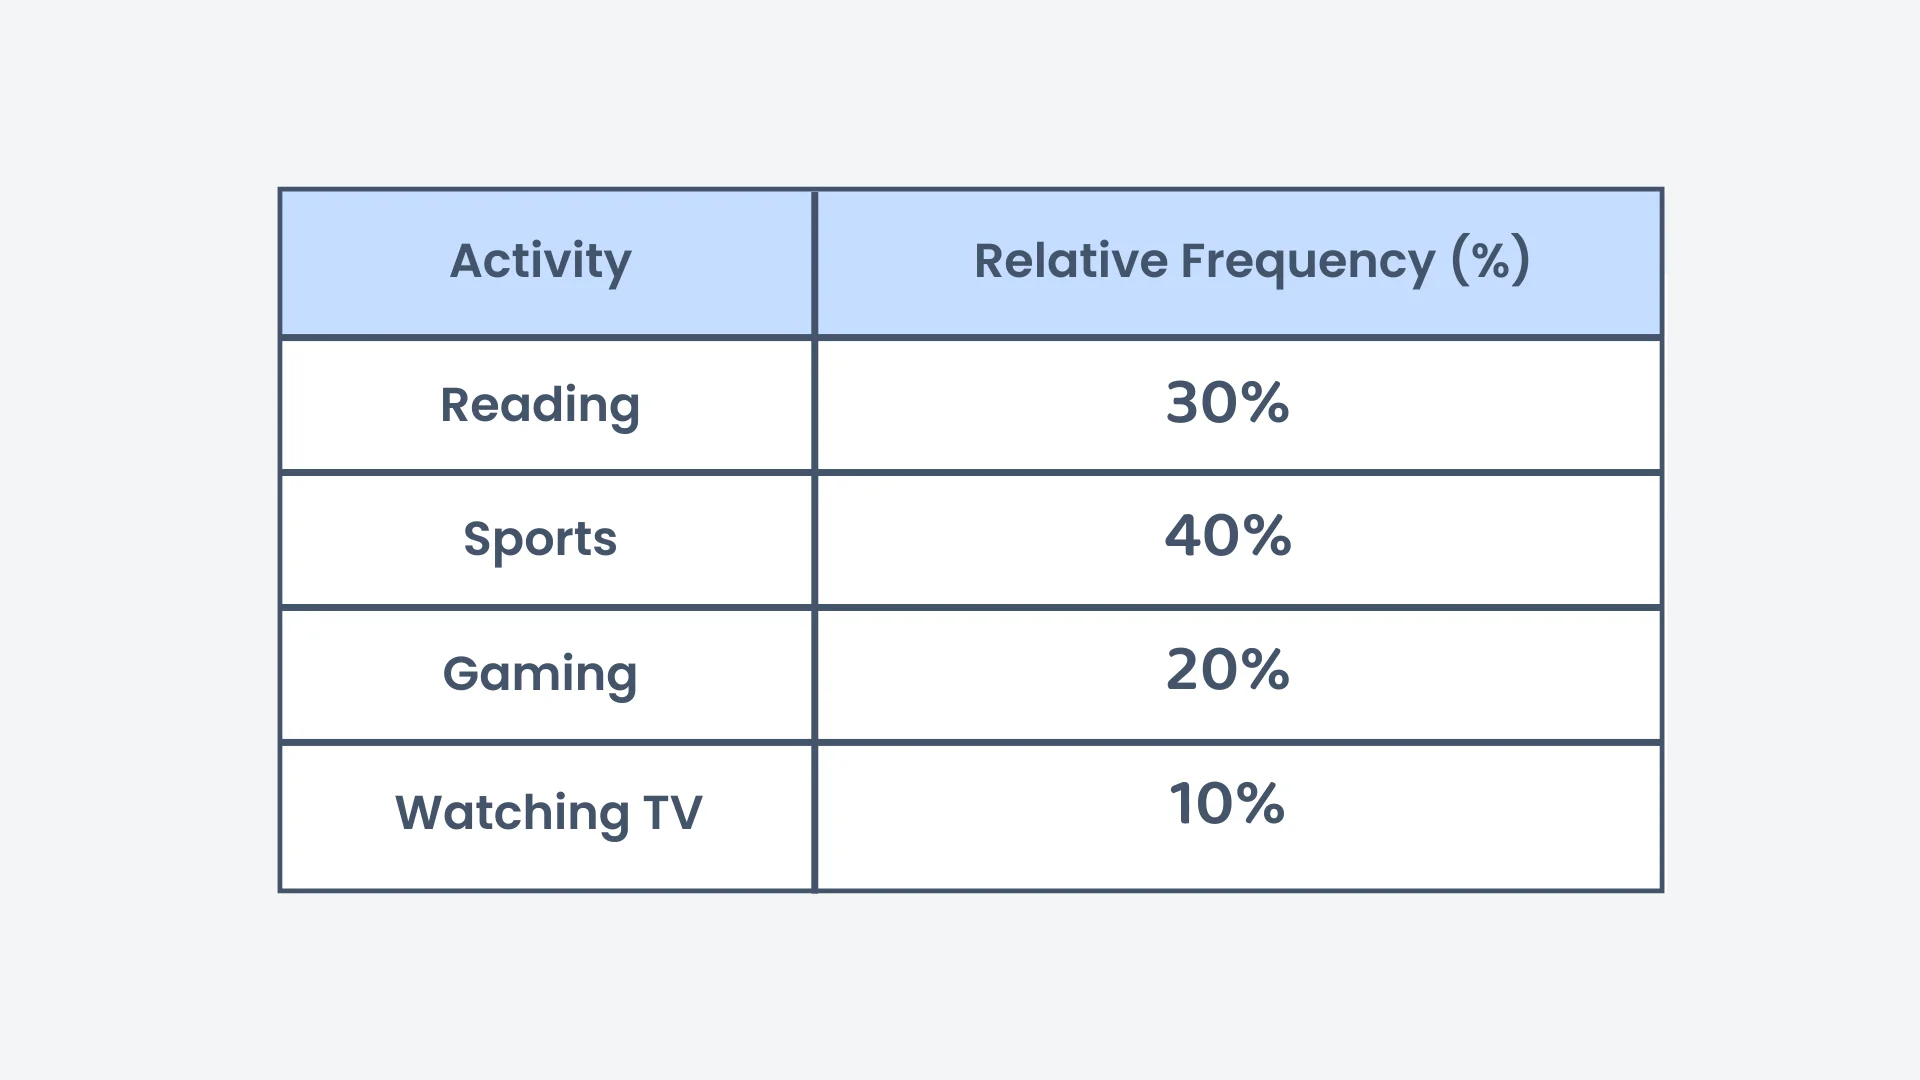
The table below shows the results of a survey of favourite activities among 50 students. How many students chose Sports as their favourite activity?
Correct! 🎉 +10 pointsNot quite right
Multiply the relative frequency () by the total count (50): .
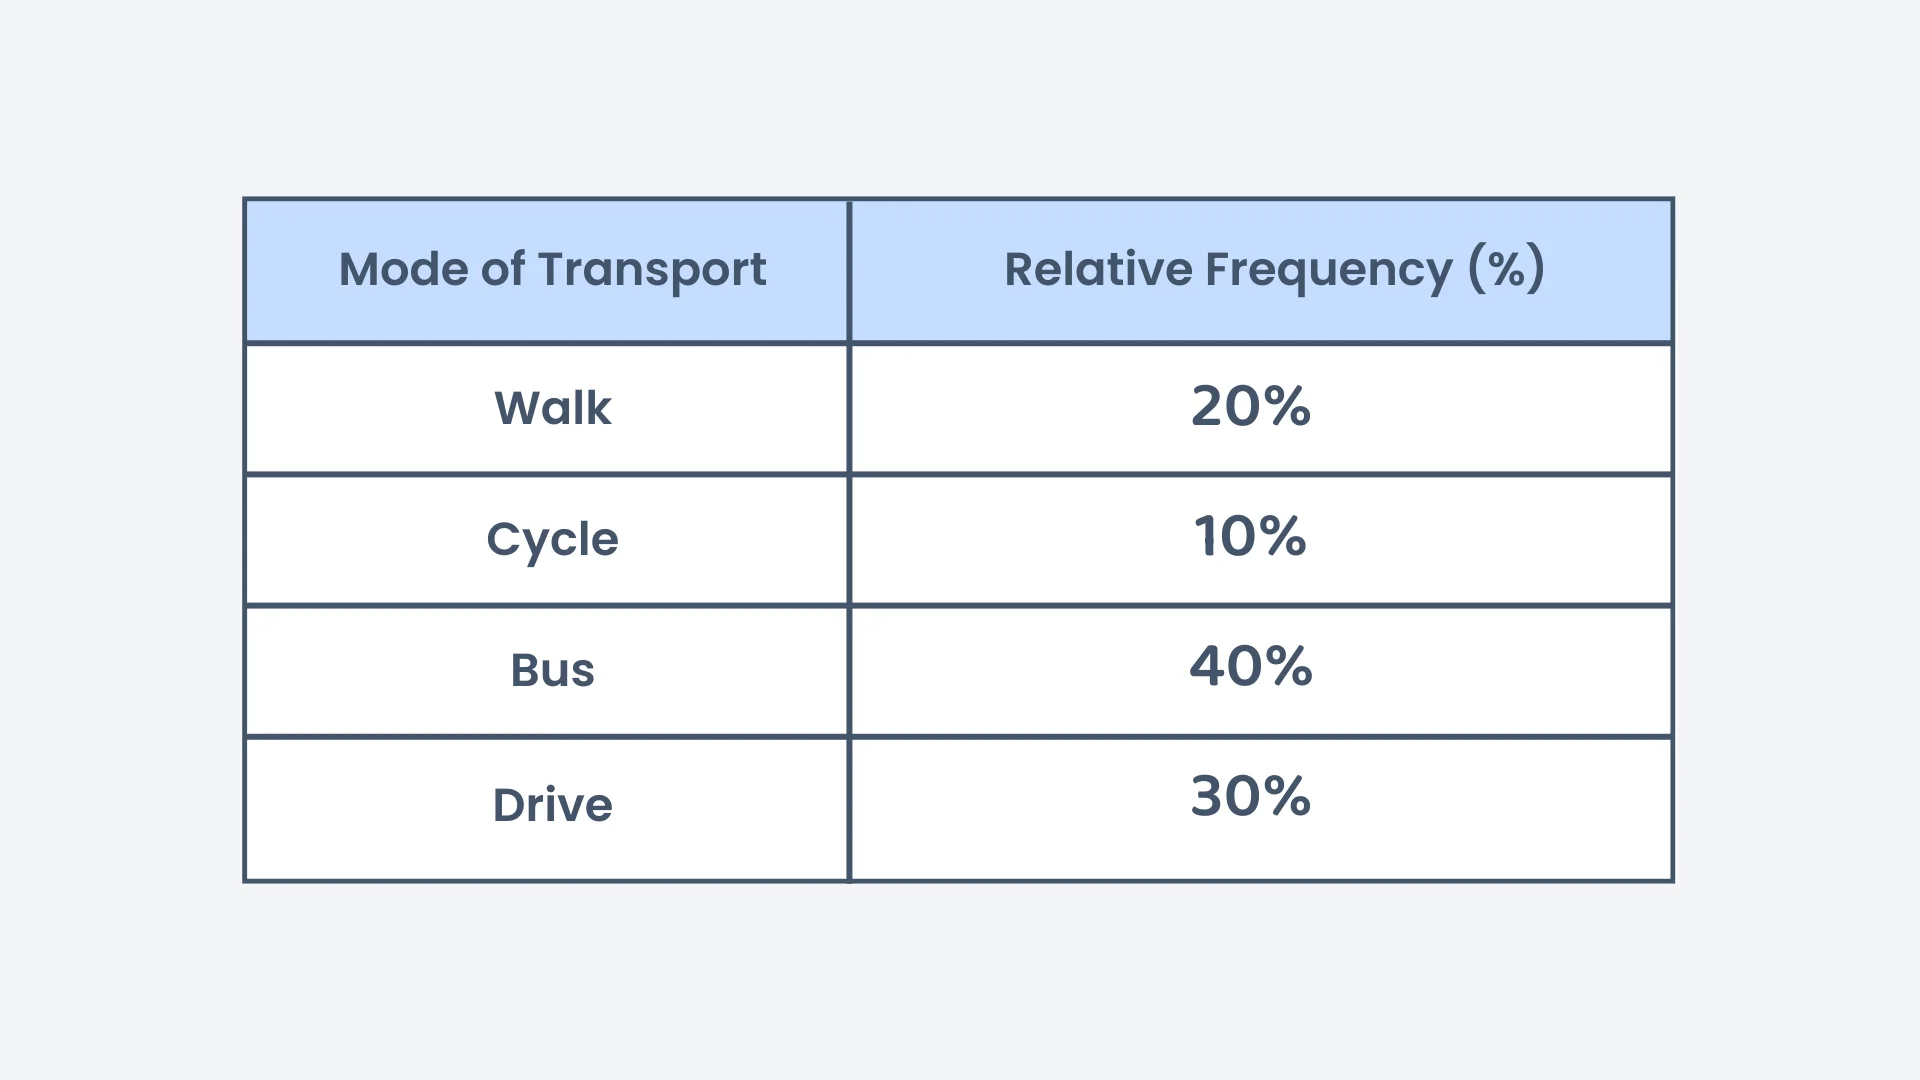
Below is the transport data for Class M. If there are 80 students in Class M, how many more students take the bus compared to cycling?
Correct! 🎉 +20 pointsNot quite right
Calculate the absolute frequencies for both. For the bus: . For cycling: . Subtract: .
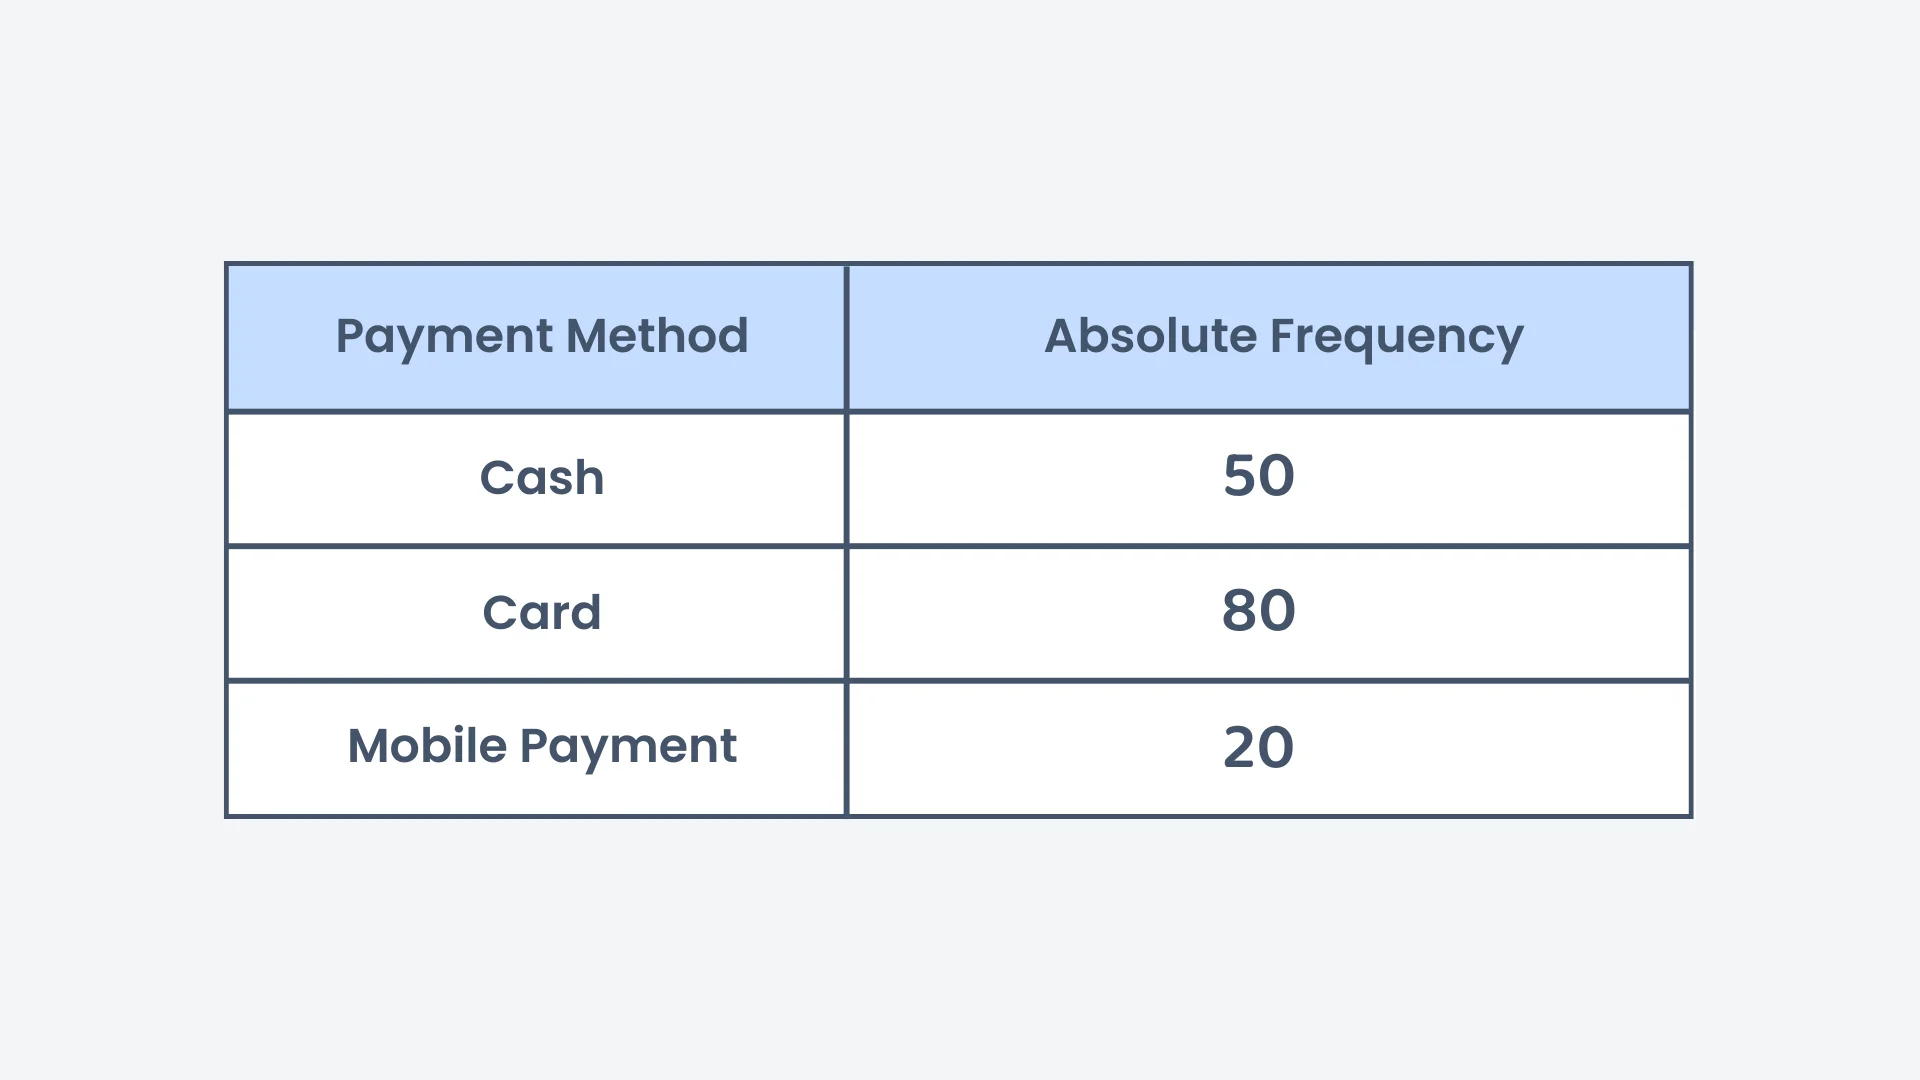
The table below shows the methods of payment used by customers at a supermarket on a day. How many degrees of a pie chart correspond to customers who paid with cash?
Correct! 🎉 +20 pointsNot quite right
Divide the absolute frequency of customers who paid with cash (50) by the total count (150): . Then multiply by : .
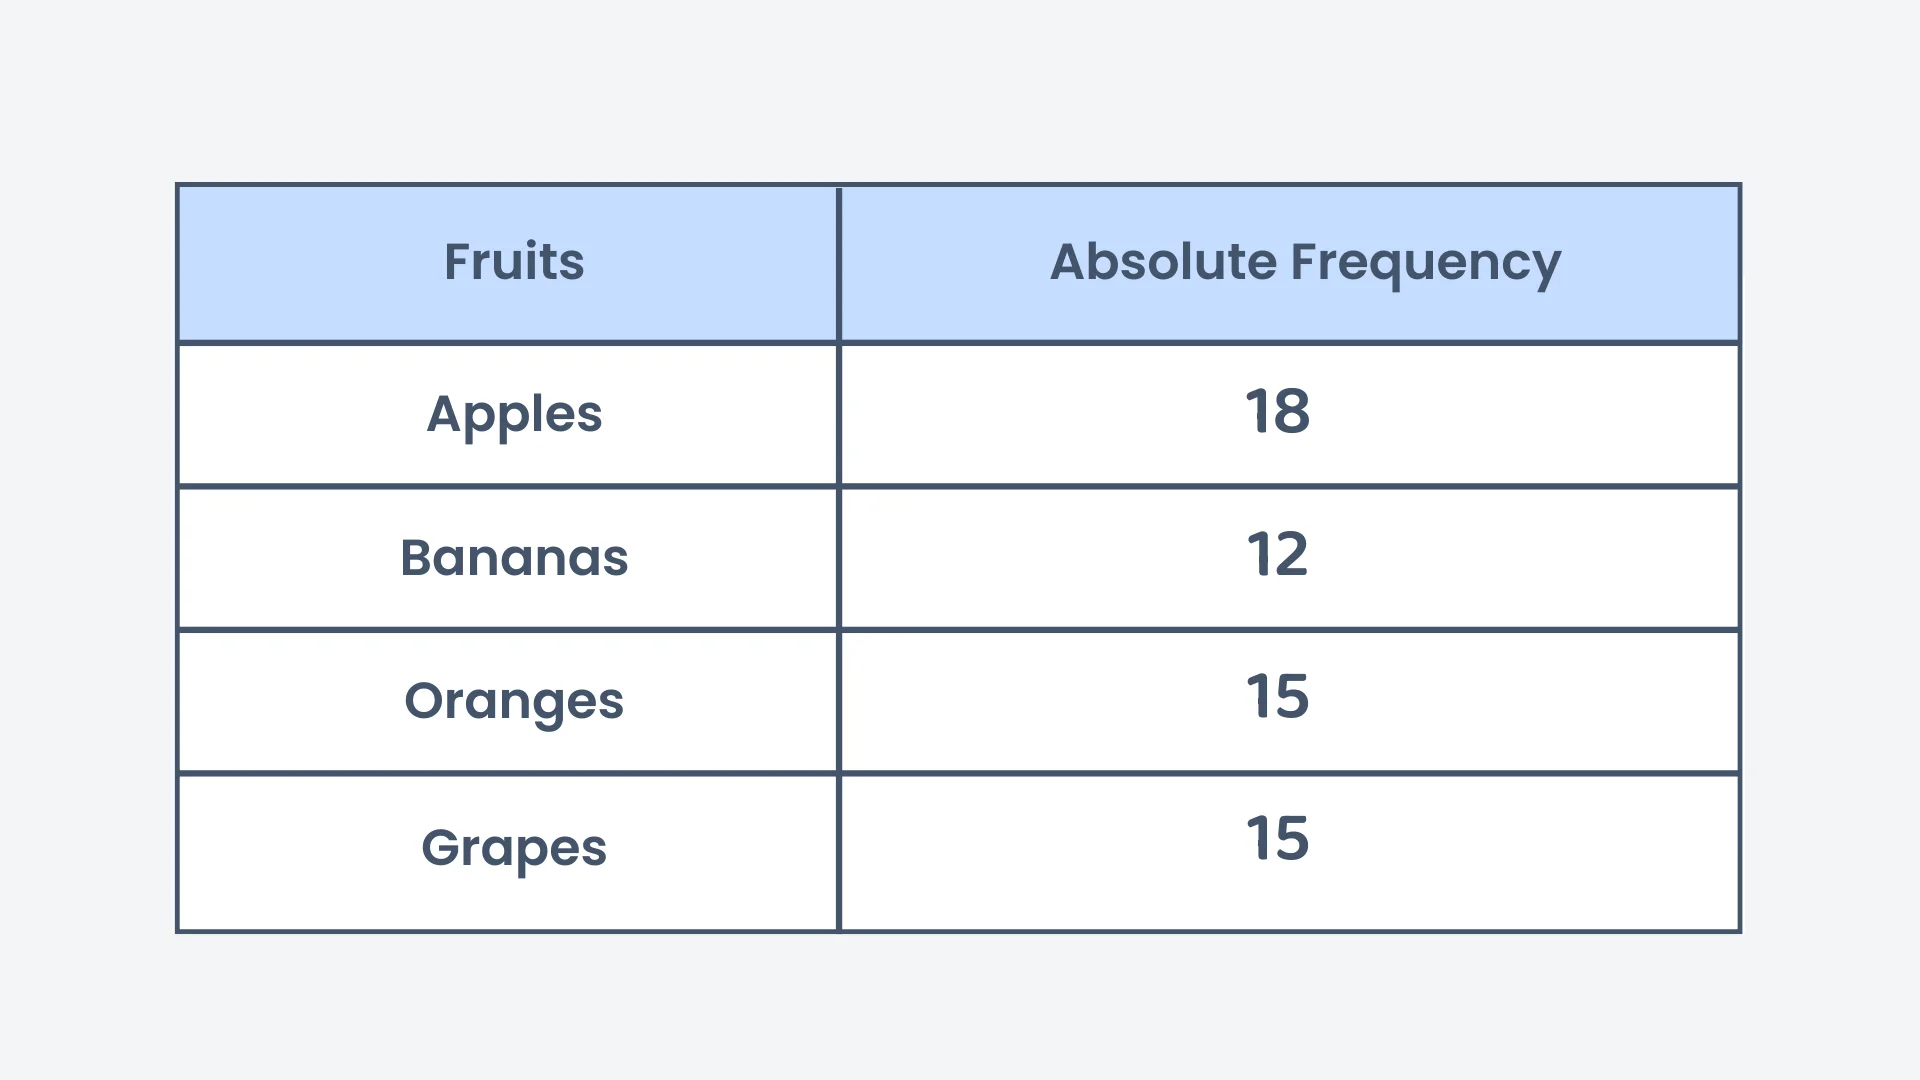
The table below shows the results of a survey on students’ favourite fruits among 60 students in Class Q. What is the relative frequency of students who prefer bananas, and how many degrees of a pie chart does this represent?
Correct! 🎉 +20 pointsNot quite right
Divide the absolute frequency of students who prefer bananas (12) by the total number of students (60): , which equals . Multiply by for the pie chart: .
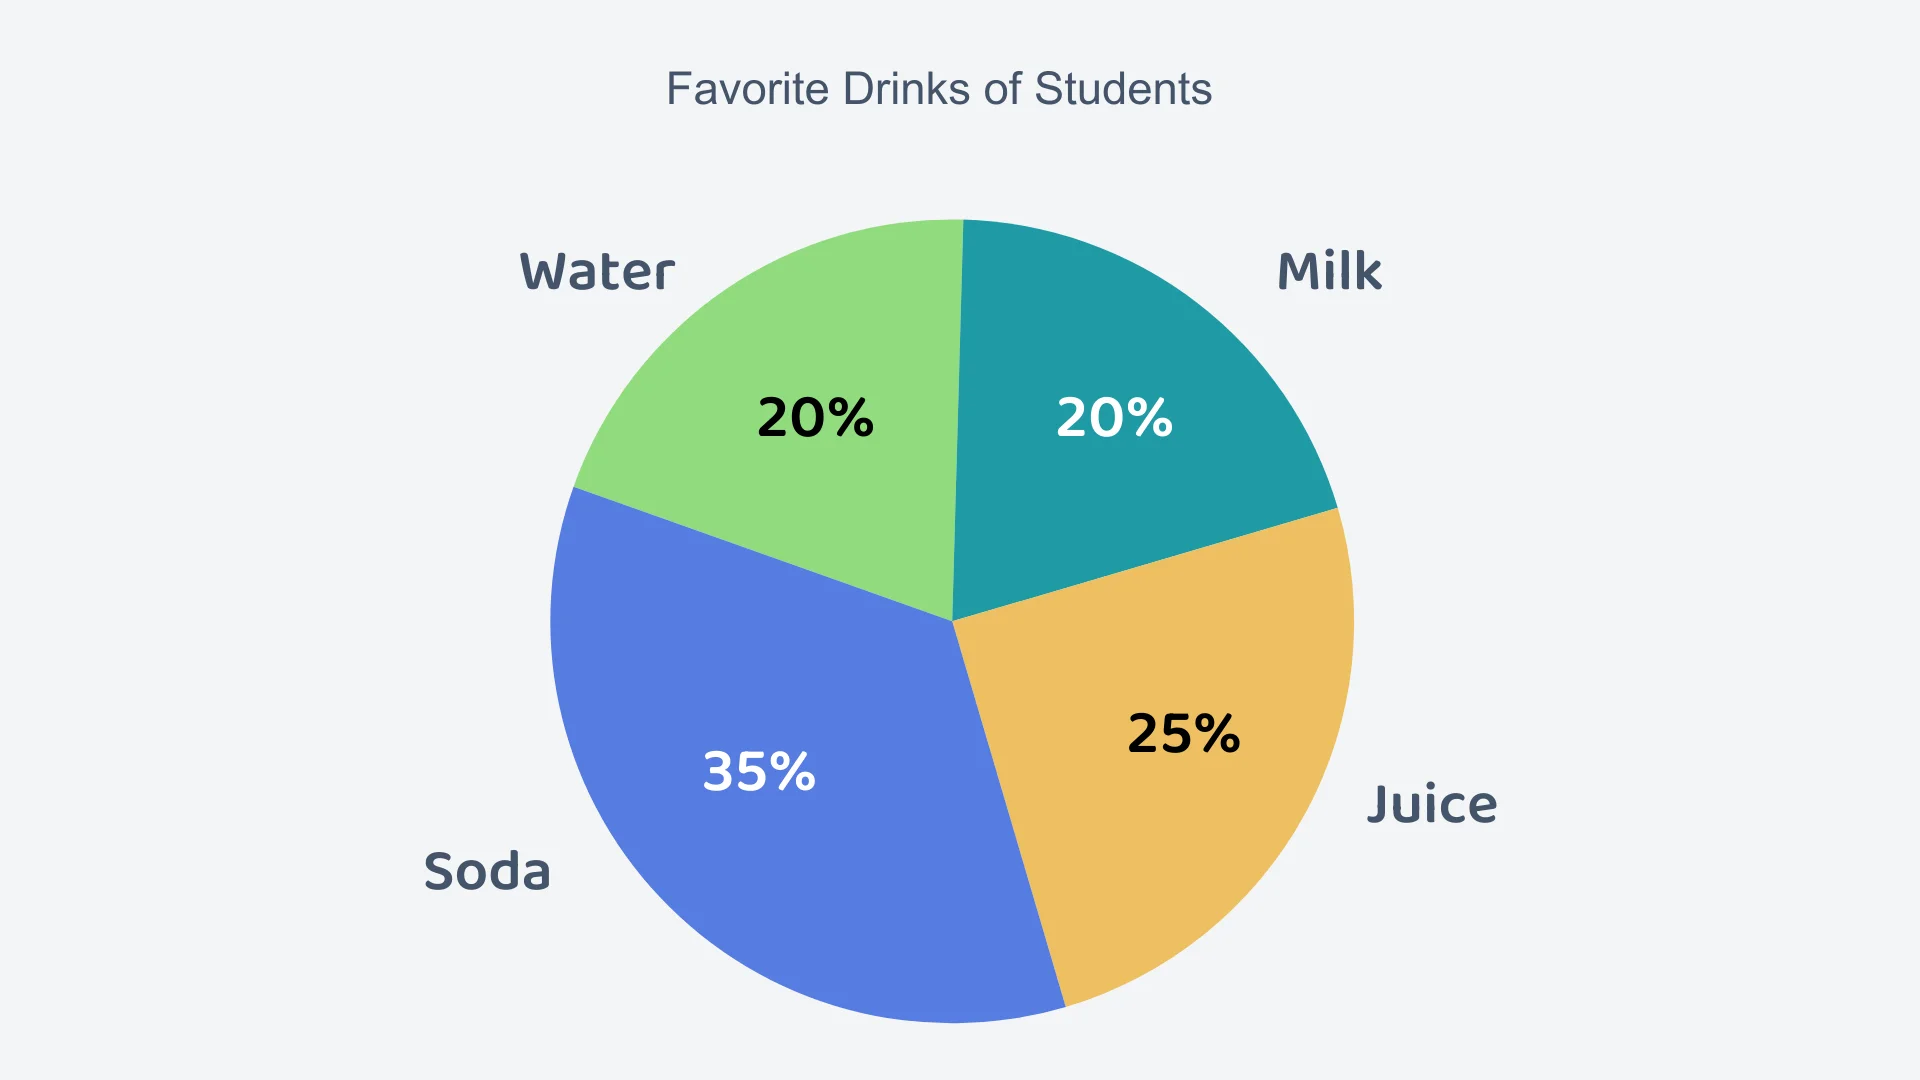
The pie chart below represents the favourite drinks of 90 students. How many students prefer Milk? How many degrees of the pie chart correspond to it?
Correct! 🎉 +30 pointsNot quite right
Multiply the relative frequency () by the total students: . To find the corresponding angle, multiply by : .
Want to see the full working?
Interactive Activity
Adjust sliders to see how absolute frequency and relative frequency are connected
Loading interactive widget...
Students Also Ask
The questions students bump into most on this topic
Absolute frequency counts how many times a category appears in a data set. Relative frequency shows that count as a proportion of the total. If 5 out of 25 students walk to school, the absolute frequency is 5 and the relative frequency is 20%. Absolute frequency uses whole numbers, while relative frequency uses fractions, decimals, or percentages.
Yes. The sum of all relative frequencies in a data set always equals 1 (or 100%). Every item belongs to exactly one category. If your relative frequencies do not add up to 1, you have made a calculation error. This rule gives you a useful way to double-check your working in exam questions.
You find relative frequency by dividing the absolute frequency of a category by the total count. If 12 out of 25 students take the bus, the relative frequency is 12 ÷ 25 = 0.48, or 48%. You can express the result as a fraction, decimal, or percentage depending on what the question requires.
No. Relative frequency represents a proportion of the total, so it always falls between 0 and 1 (or 0% and 100%). A value of 0 means the category never occurs, while 1 means every data point belongs to that category. If your result exceeds 1, check you divided the absolute frequency by the total count.