How to Calculate the Mean, Median, Mode and Range
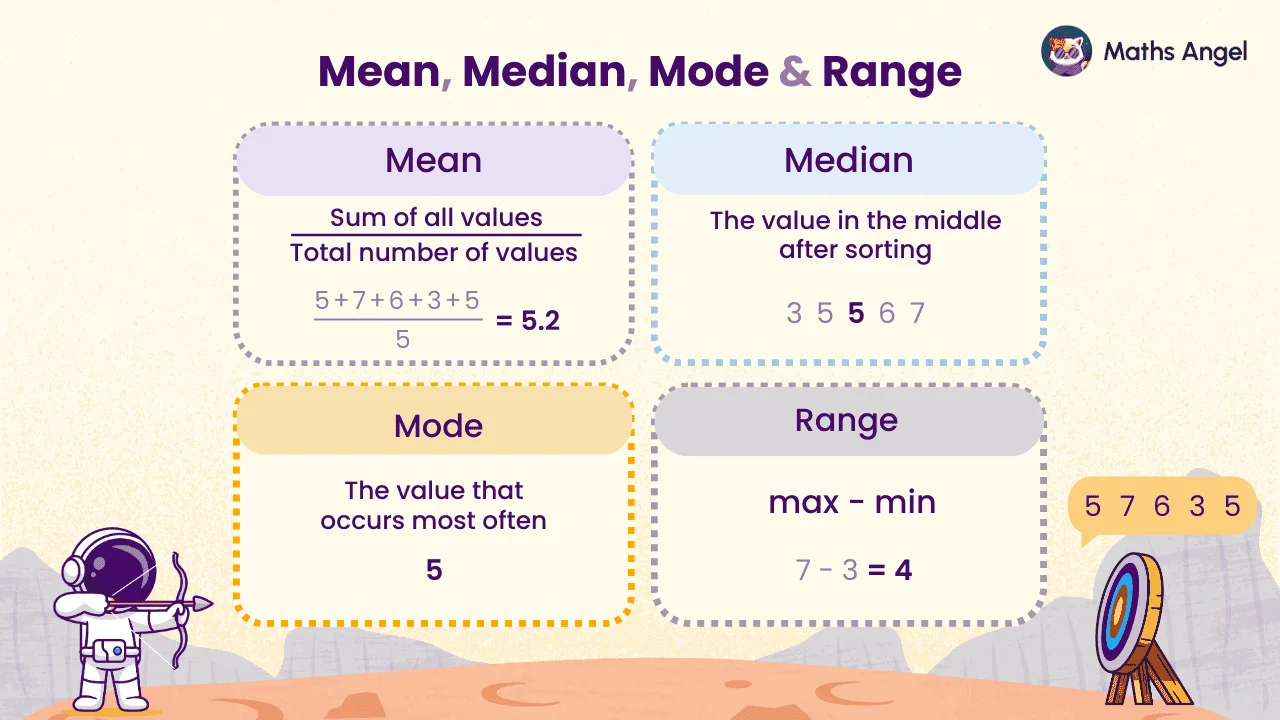
Mean, median, mode and range are four ways to describe data. The mean is the average, the median is the middle value once sorted, and the mode is the most common. The range is largest − smallest.
Video Lesson
Watch and learn the basics
🎬 Did this video explain it clearly?
Flashcards
Review key concepts visually
%20Mean.webp)
%20Median.webp)
%20Mode.webp)
%20Range.webp)
How to Calculate the Mean?
- Add up all the values.
- Divide by how many values there are.
How to Find the Median?
- Put the numbers in order from smallest to largest.
- Find the middle value (or average the two middle values).
How to Find the Mode?
- The mode is the value that appears most often.
- There can be more than one mode, or no mode.
How to Calculate the Range?
- Range = largest value − smallest value.
- A small range means the data is more consistent.
Practice Questions
Test your understanding
Your scores are 3, 5, 9, 5, 8. What is the mean?
Correct! 🎉 +10 pointsCorrect! 🎉 Worth 10 XPNot quite right
Add all five scores: .
Then divide by how many scores there are: .
Every score counts, including the repeated 5, so you divide by 5 and not by 4. Note that the mean, 6, is not one of the scores. That is perfectly normal. (The mode and the median of this list are both 5.)
These are your scores: 10, 3, 7, 6, 5. What is the range?
Correct! 🎉 +10 pointsCorrect! 🎉 Worth 10 XPNot quite right
Put the scores in order first: 3, 5, 6, 7, 10.
The range is the largest value minus the smallest: .
The range is a single number describing the spread, not a pair of values such as "3 to 10", and not one of the averages. (The median of this list is 6.)
Here are your scores: 5, 8, 6, 6, 7, 7, 7, 10. What is the mode?
Correct! 🎉 +20 pointsCorrect! 🎉 Worth 20 XPNot quite right
Put the scores in order: 5, 6, 6, 7, 7, 7, 8, 10.
The mode is the value that appears most often. The 7 appears three times, more than any other value, so the mode is 7.
Three things to watch: the answer is the value (7), not how many times it appears (3); 6 appears twice, often enough to notice, but not the most; and the mode is the most frequent value, not the biggest one (10).
Your scores are 3, 8, 5, 6, 10, 8. What is the median?
Correct! 🎉 +20 pointsCorrect! 🎉 Worth 20 XPNot quite right
Sort the scores first: 3, 5, 6, 8, 8, 10.
There are 6 scores, an even number, so the median is the mean of the two middle ones, the 3rd and the 4th: .
You must average both middle values. The median does not have to be one of the scores, so 7 is a perfectly good answer even though it is not in the list. (8 is the mode here, not the median.)
Your scores are: 9, 7, 10, 7, 6, 7, 8. What is the median if the lowest score (6) is removed?
Correct! 🎉 +20 pointsCorrect! 🎉 Worth 20 XPNot quite right
Removing the 6 leaves 9, 7, 10, 7, 7, 8.
In order: 7, 7, 7, 8, 9, 10. There are now 6 scores, so the median is the mean of the 3rd and 4th values: .
The median does not have to be one of the scores. With an even number of values it often lands halfway between two of them. (For this list the mode is 7 and the mean is .)
Here are your scores: 6, 7, 7, 9, 5, 8. If you add another score of 100, how will the mean, median, and mode change?
Correct! 🎉 +30 pointsCorrect! 🎉 Worth 30 XPNot quite right
With the new score, in order, the data is 5, 6, 7, 7, 8, 9, 100.
Mean: it was ; it is now . One value far above the rest drags the mean up a long way, so the mean increases.
Median: with 7 values the median is the 4th one in order, which is still 7. The 100 only sits at the end of the list, so the median stays the same.
Mode: 7 still appears twice, more than any other value, so the mode stays the same. This is why the median and mode are called resistant to outliers, while the mean is not.
Want to see the full working?
Interactive Activity
Explore Mean, Median, Mode, and Range
Loading interactive widget...
Frequently asked questions
The questions students bump into most on this topic
Four ways to describe a set of numbers. The mean is the average: add the values and divide by how many there are. The median is the middle value once the numbers are in order. The mode is the value that appears most often. The range is the largest value minus the smallest, which shows how spread out the numbers are.
Add up all the values, then divide by how many values there are. For the scores 3, 5, 9, 5 and 8: 3 + 5 + 9 + 5 + 8 = 30, and 30 ÷ 5 = 6, so the mean is 6. The mean is also called the arithmetic mean, and it is what people usually mean by “the average”.
Put the values in order from smallest to largest and take the middle one. With an even number of values there are two middle ones, so take their average. The formula (N + 1) ÷ 2 gives the position: for 10 values it is 5.5, between the 5th and 6th. So the median of 1 to 10 is (5 + 6) ÷ 2 = 5.5.
The mode is the value that appears most often, so count how many times each value occurs. In the scores 5, 8, 6, 6, 7, 7, 7, 10, the 7 appears three times, so the mode is 7. If two values tie for the most, there are two modes; if every value appears once, there is no mode.
The range is the largest value minus the smallest. In the archery scores the highest is 7 and the lowest 3, so the range is 7 − 3 = 4. For the numbers 1 to 10 it is 10 − 1 = 9, and for 21, 6, 17, 18, 12, 8, 4, 13 it is 21 − 4 = 17. A small range means the values are consistent.
Mode sounds like “most”: the value that appears most often. Median has the same root as “medium” and the middle of a road: the middle value. Mean is the one that makes you work, adding and dividing. Range is how far the numbers range, from smallest to largest.
What's next?
Found this one hard? Go one step back first. Feeling confident? Carry on to the next lesson.