
Statistics
The complete statistics curriculum for ages 10 to 16, with every topic taught in its own bite-sized video lesson. Build real confidence at your own pace, with an AI tutor whenever you get stuck.
%20Tally%20Mark%20Chart.webp)
%20Box%20Plots.webp)
Explore every Statistics topic
Averages, bar charts, pie charts and box plots. Master each one with interactive tools and practice questions.
Charts and Data Display
Tally Marks, Bar Charts, Tables
Record data in a tally chart, then draw a bar chart with equal-width bars and gaps between them.
Absolute Frequency and Relative Frequency
Relative frequency is how often something happened ÷ total trials, so 12 heads in 40 flips is 0.3.
Pie Chart
How to draw a pie chart: each item gets 360° × its share, so 5 out of 20 is a 90° slice.
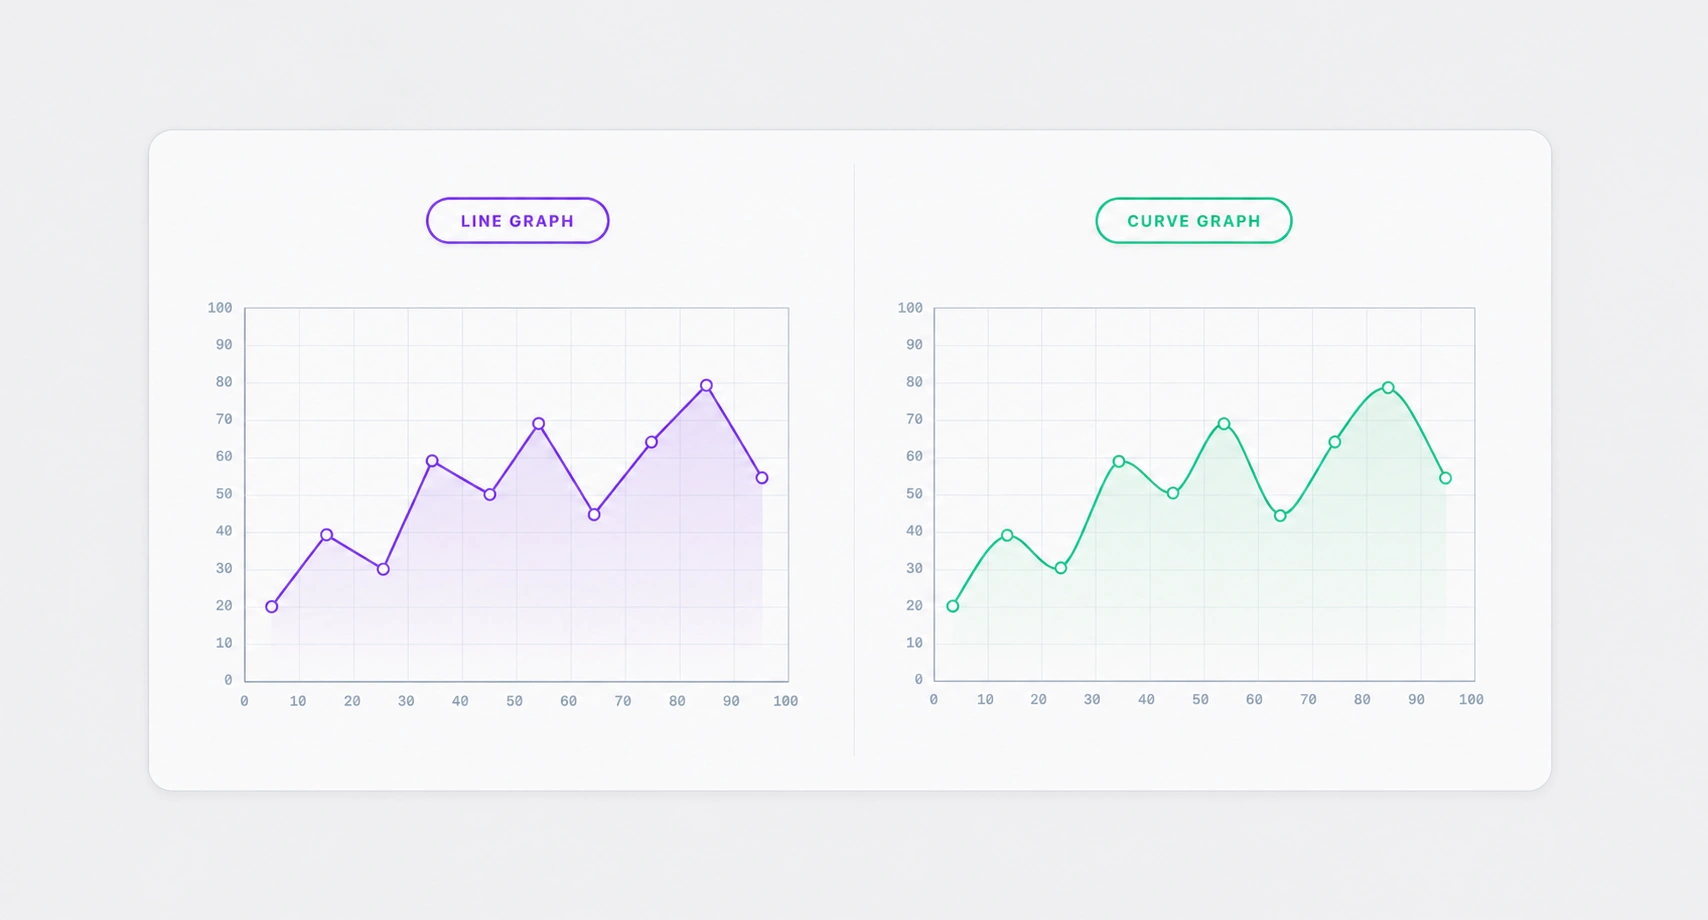
Line Graphs and Curve Graphs
A line graph shows how something changes over time; join the points when values in between make sense.
Averages and Spread
%20Mean.webp)
How to Calculate the Mean, Median, Mode and Range
Mean, median, mode and range in one page: the mean of 2, 4, 9 is 15 ÷ 3 = 5 and the range is 7.
Median, Mean, Mode and Range from a Frequency Table
Mean from a frequency table: multiply each value by its frequency, add up, divide by the total frequency.
Averages from a Grouped Frequency Table
A grouped frequency table only gives an estimated mean: use the midpoint of each group.
How to Draw and Read a Box Plot
A box plot, or box and whisker plot, shows the lowest value, the quartiles and the highest value.
Explore other Maths categories
Maths Angel covers the whole maths curriculum for ages 10 to 16. Statistics is one of six categories, so jump into any of the others.