Introduction to Functions and Graphs
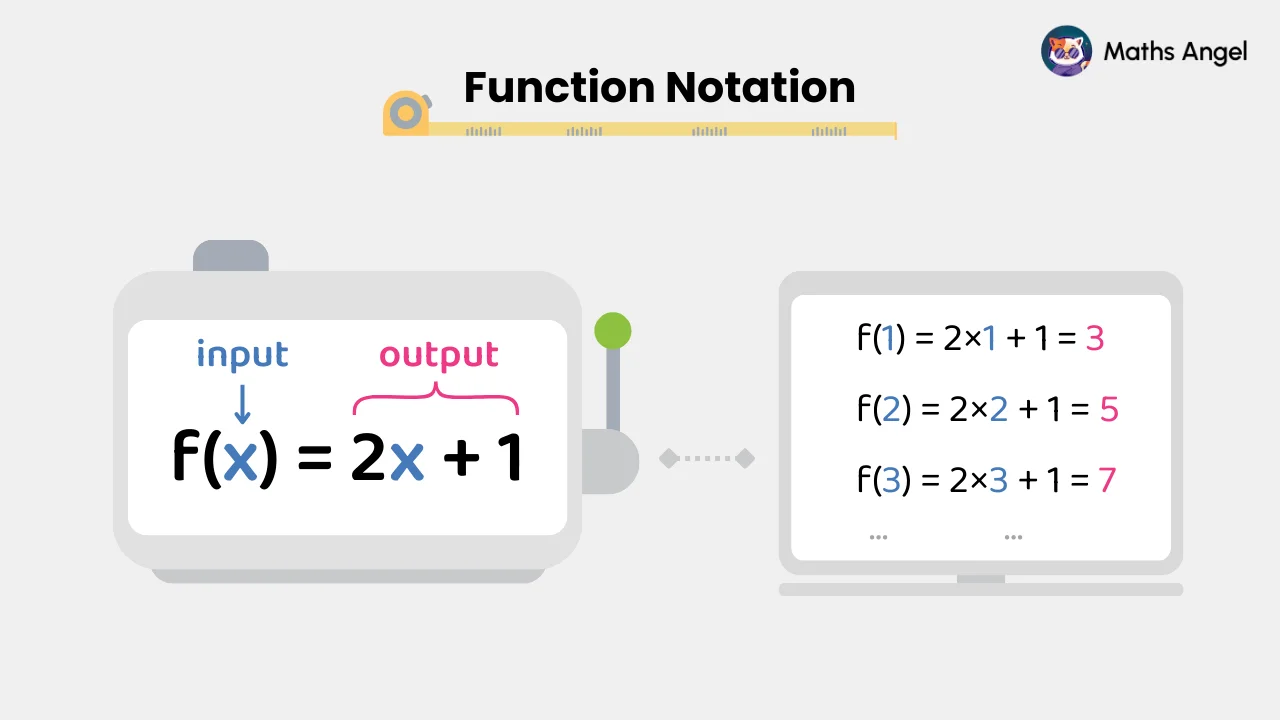
A function takes each input and turns it into exactly one output. Put x = 3 into the rule f(x) = 2x + 1 to get f(3) = 7. Show it with a table of values, then plot the points as a graph.
Video Lesson
Watch and learn the basics
🎬 Did this video explain it clearly?
Flashcards
Review key concepts visually
%20Function%20Notation.webp)
%20Plot%20a%20Graph.webp)
%20Graphs%20that%20do%20not%20represent%20a%20function.webp)
%20Reading%20Function%20Values%20from%20Graphs.webp)
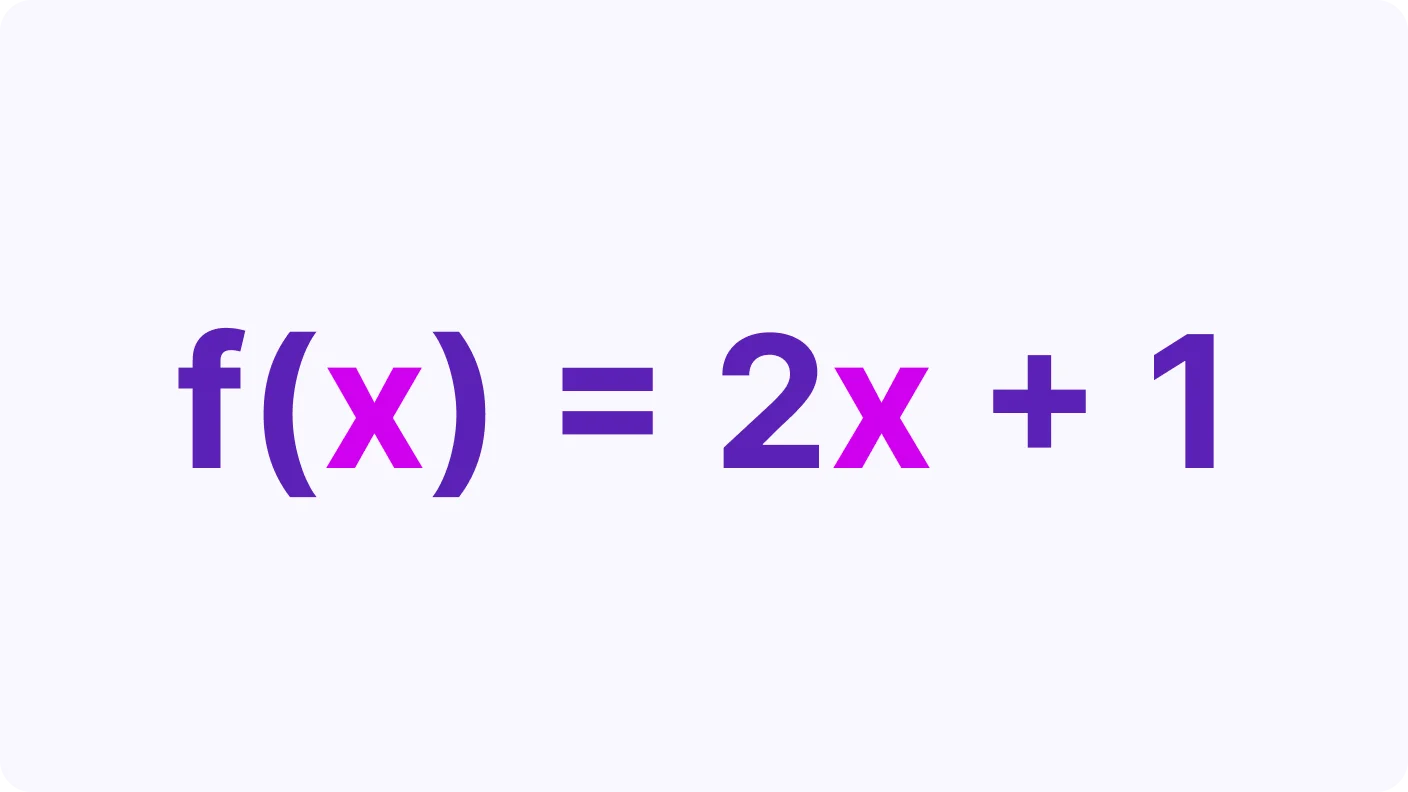
What Does Function Notation f(x) Mean?
- shows the output when the input is x.
- To find , substitute into the rule.
- For example, if , then .
How to Graph a Function?
- First create a table by choosing x-values and finding the matching f(x) values.
- Then plot the points on a graph and join them with a straight or smooth line.
Does a Graph Represent a Function?
- A graph is a function if each x-value has only one y-value.
- If one x-value has more than one y-value, it is not a function.
Reading Function Values from Graphs
- To find f(x), go to the x-value and read the y-value on the graph.
- Solving means the y-value is zero. This happens where the graph crosses the x-axis.
Practice Questions
Test your understanding
What is the output of the function when ?
Correct! 🎉 +10 pointsNot quite right
When , .
What is the output of the function when ?
Correct! 🎉 +10 pointsNot quite right
When , .
For the function , what is the value of ?
Correct! 🎉 +20 pointsNot quite right
The 3 inside the brackets means we are replacing x with the value 3. So, .
For the function , what is x when is 7?
Correct! 🎉 +20 pointsNot quite right
Substitute 7 for , so we have the equation: . First, add 5 to both sides to get . Then, divide both sides by 3 to find .
For the function , what is the value of ?
Correct! 🎉 +20 pointsNot quite right
To find , substitute into the function. So, .
Based on the graph, what are the values of x when ?
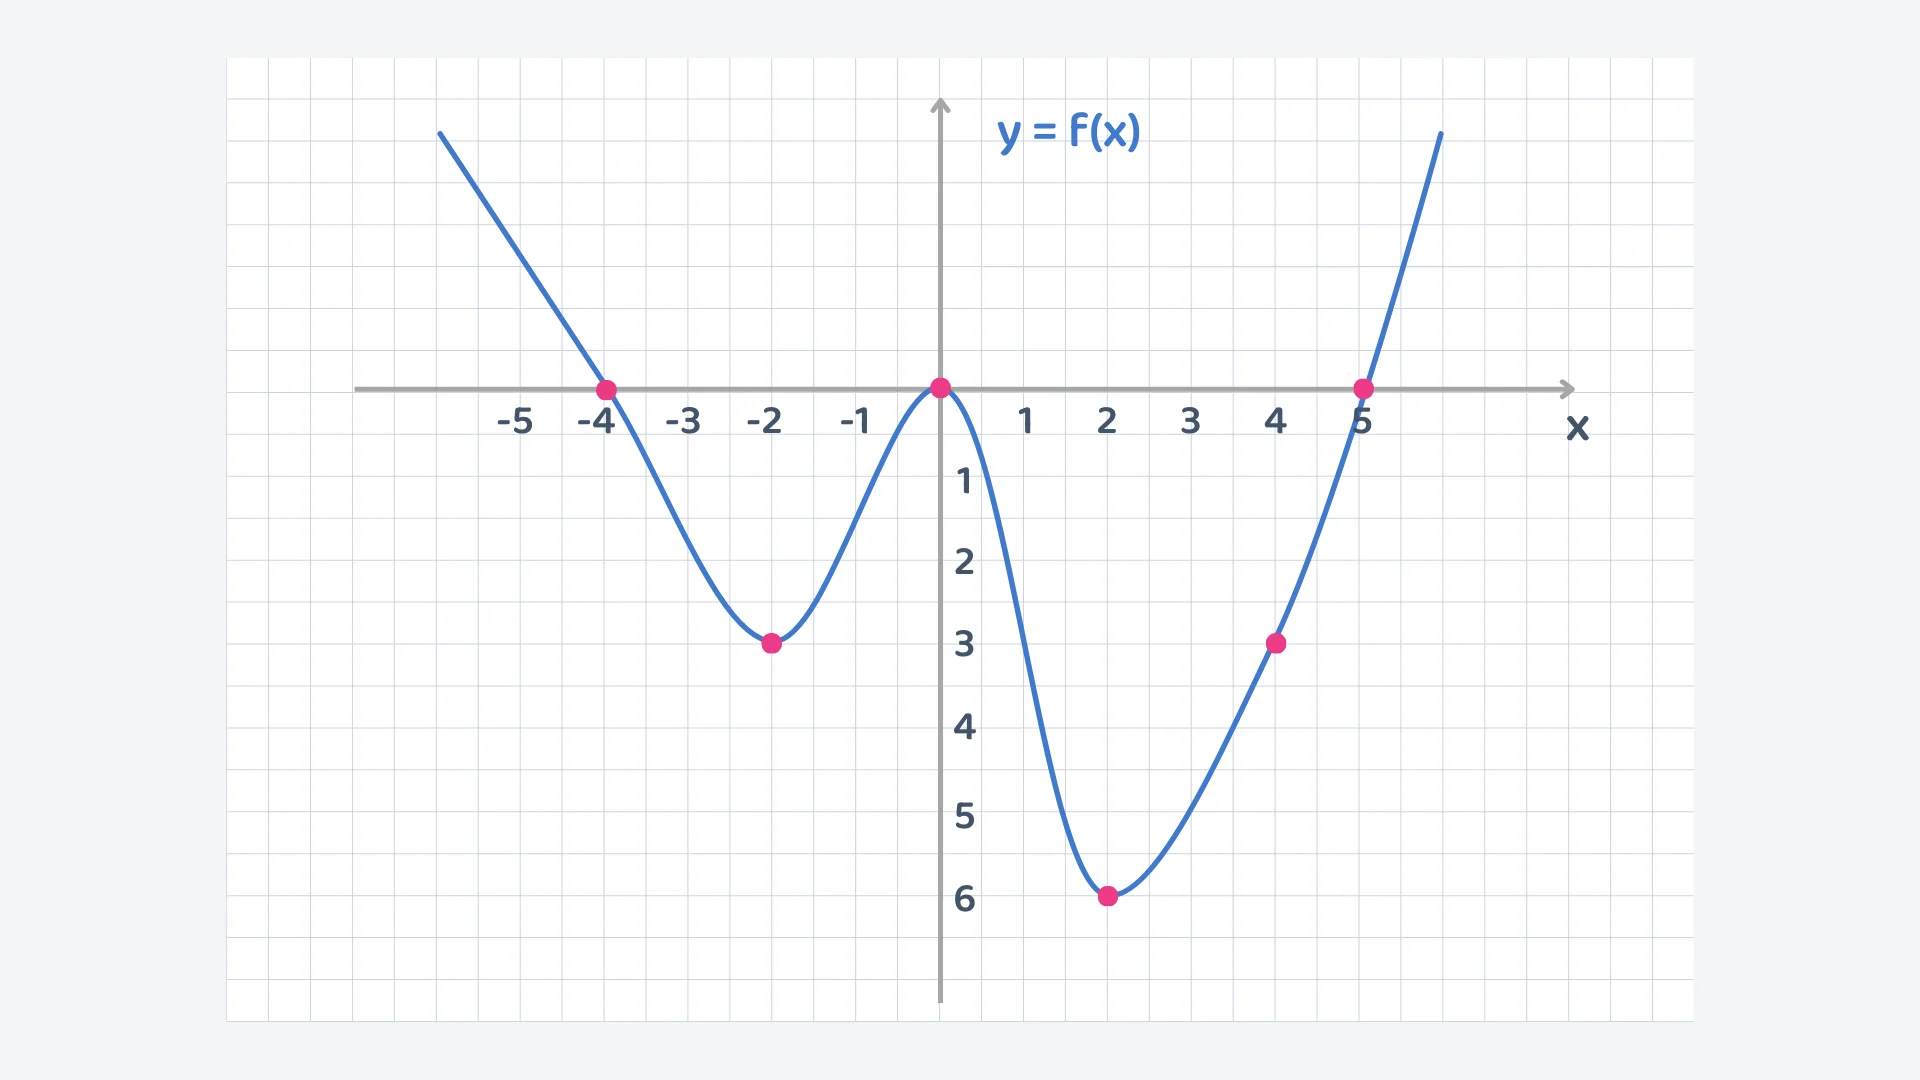
Correct! 🎉 +30 pointsNot quite right
From the graph, we can see that the function intersects the horizontal line at and . Therefore, the correct answer is 4 and −2.
Want to see the full working?
Interactive Activity
Introduction to functions and graphs
Loading interactive widget...
Students Also Ask
The questions students bump into most on this topic
A function takes each input and gives exactly one output. You write it as f(x), where x is the input and the value after the equals sign is the output. For example, f(x) = 2x + 1 turns an input of 1 into an output of 3.
In f(x), the letter f stands for the function and x stands for the input. Whatever comes after the equals sign is the output. So for f(x) = 2x + 1, putting in x = 2 gives f(2) = 5, which means the output is 5.
Check whether any input has more than one output. If a single x-value lines up with more than one y-value, the graph is not a function. A function must give exactly one output for each input, so every input can match only one output.
Yes. One output value can come from several different inputs, and the relationship is still a function. The defining feature of a function is that each input has exactly one output, not that each output has only one input, so repeated outputs are fine.
Remember that y is the output of f(x). To find f(-2), locate x = -2 on the horizontal axis, move to the curve, then read the matching y-value. To solve f(x) = 0, find the inputs where the graph crosses the x-axis.
A function machine is a simple way to picture a function. You put a number in as the input, the machine applies its rule, and one number comes out as the output. For example, the rule 2x + 1 turns an input of 1 into an output of 3.