Probability Tree Diagrams
A probability tree diagram shows all possible outcomes of a two-stage event step by step. You multiply along the branches to find one path. Then add the paths for a combined event.
Video Lesson
Watch and learn the basics
🎬 Did this video explain it clearly?
Flashcards
Review key concepts visually
%20What%20is%20a%20Probability%20Trees%20Diagrams.webp)
%20How%20to%20Draw%20Probability%20Trees%20Diagrams.webp)
%20Probability%20Tree%20Diagram%20Outcomes.webp)
%20Finding%20Probabilities%20with%20Probability%20Tree%20Diagram.webp)
%20Calculating%20Probabilities%20using%20Probability%20Tree%20Diagrams.webp)
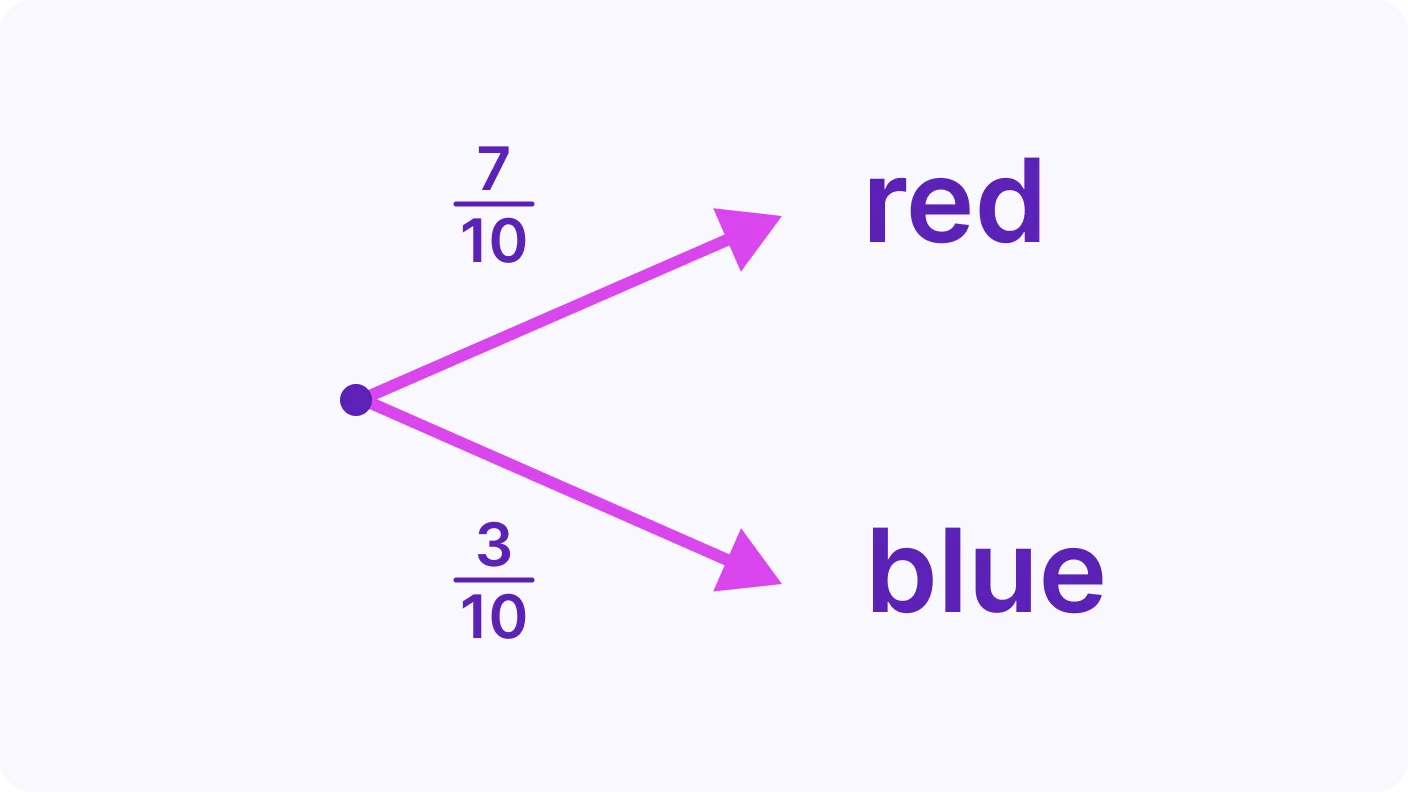
What Is a Probability Tree Diagram?
- A probability tree diagram shows all possible outcomes step by step.
- It is used for two-stage events, like drawing one ball at a time.
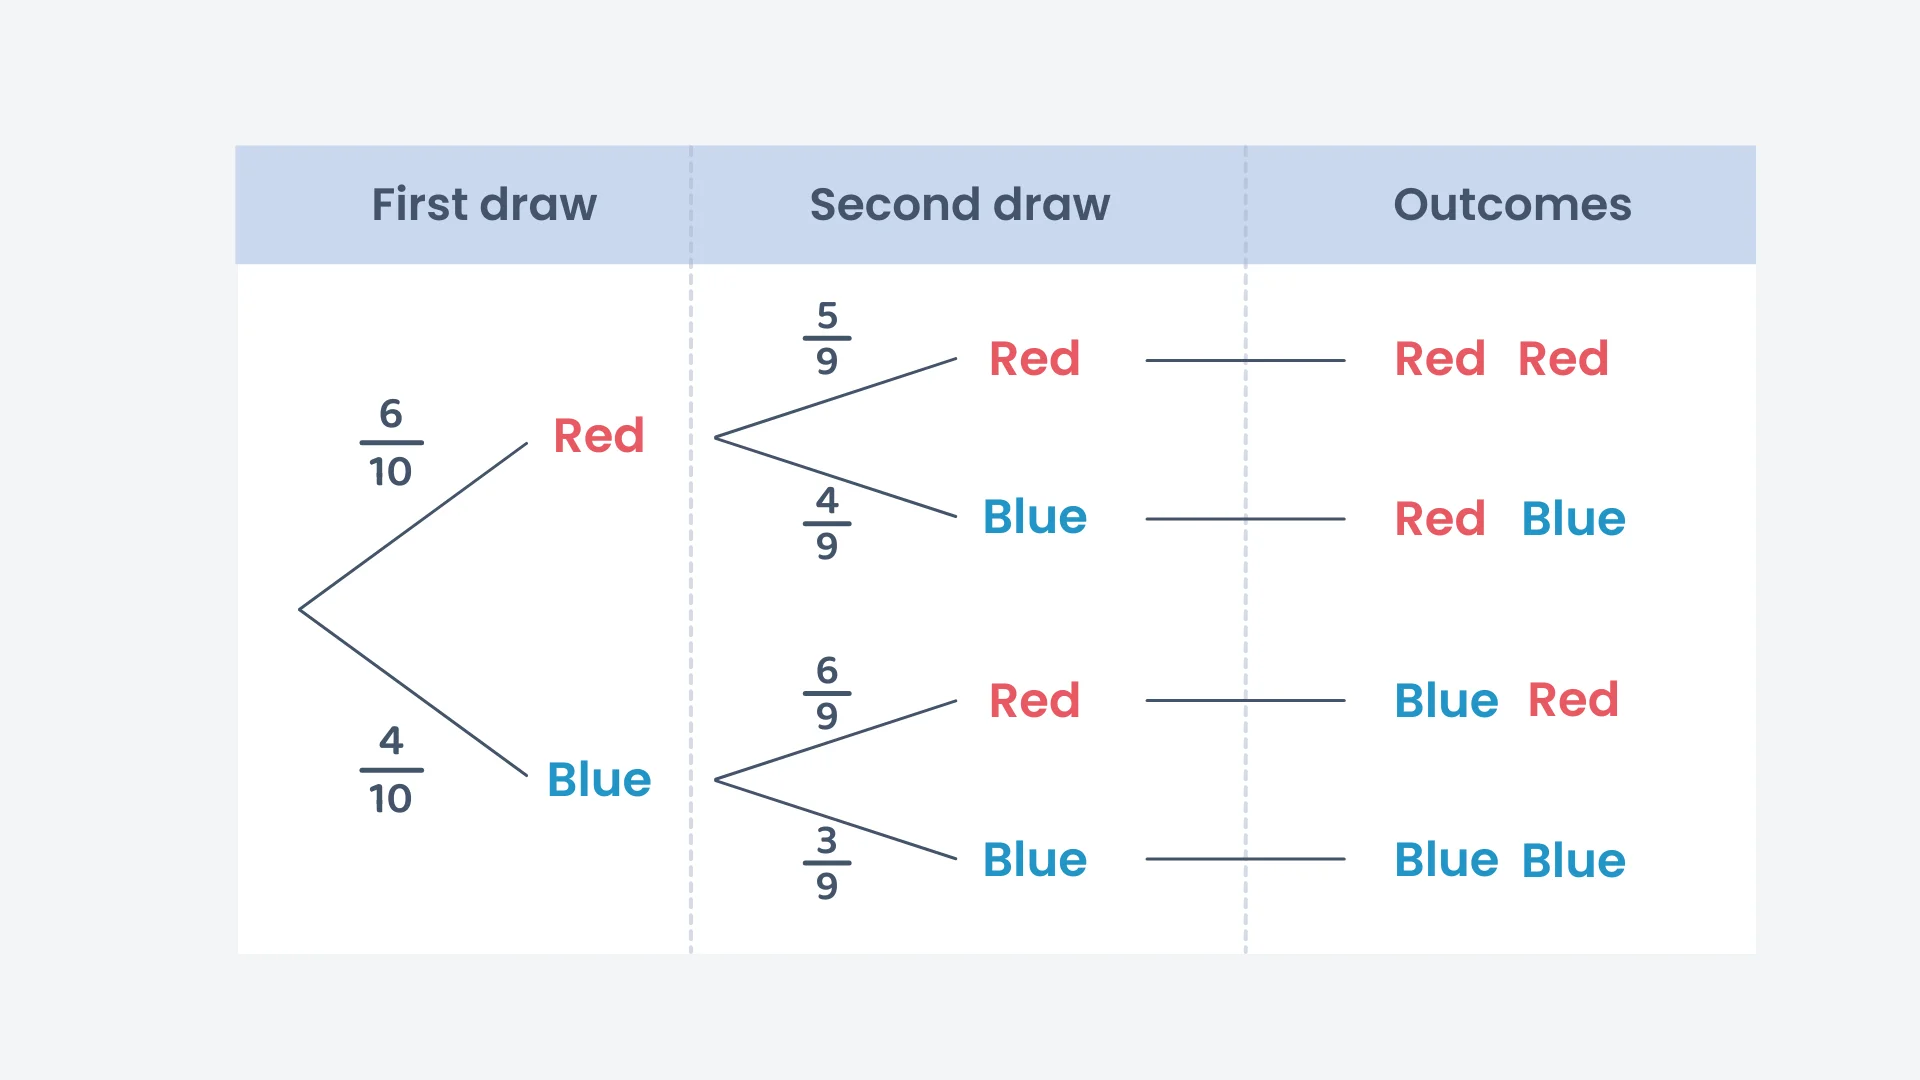
Drawing the Probability Tree Correctly
- Write fractions on every branch so probabilities are clear.
- After the first outcome, update the probabilities for what is left.
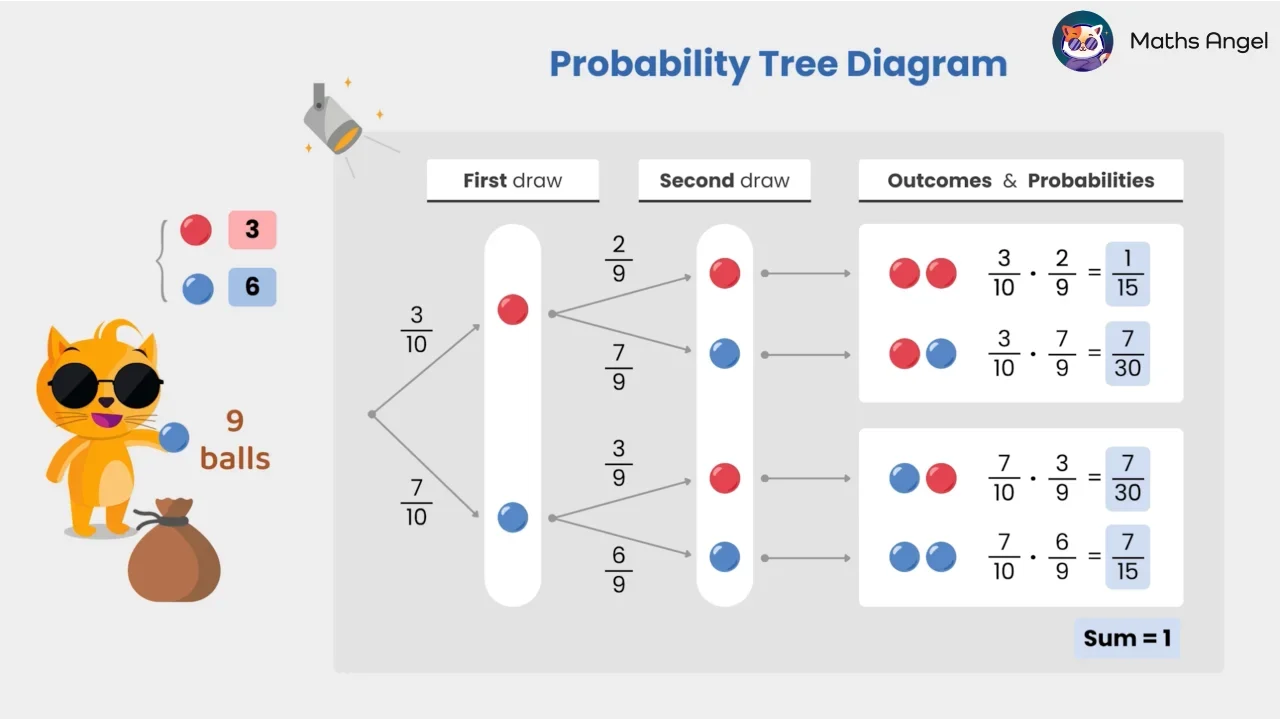
Finding the Probability of a Single Outcome
- You multiply the probabilities along one path.
- This gives the probability of one specific result.
Finding the Probability of a Combined Event
- A combined event means more than one path fits the question.
- You add the probabilities of paths like red-red and blue-blue.
Probability of At Least One Event Happening
- You can add all paths where the event happens.
- Or do 1 − probability of the opposite to save time and check your answer.
Practice Questions
Test your understanding
In a bag with 10 balls (6 red and 4 blue), what is the probability of drawing a red ball on the first draw?
Correct! 🎉 +10 pointsNot quite right
There are 6 red balls out of a total of 10 balls. The probability of drawing a red ball is , which simplifies to .
In a bag with 10 balls (6 red and 4 blue), what is the probability of drawing a blue ball on the first draw?
Correct! 🎉 +10 pointsNot quite right
There are 4 blue balls out of 10 total balls. The probability is , which simplifies to .
If you draw a blue ball on the first draw from a bag of 10 balls (6 red and 4 blue), what is the probability of drawing another blue ball on the second draw?
Correct! 🎉 +20 pointsNot quite right
After drawing one blue ball, there are 3 blue balls left out of 9 total balls. The probability is , which simplifies to .
If your first draw from a bag of 6 red balls and 4 blue balls is a blue ball, what is the probability of drawing a red ball on the second draw without replacement?
Correct! 🎉 +20 pointsNot quite right
After drawing one blue ball, there are 6 red balls left out of 9 total balls. The probability of drawing a red ball is , which simplifies to .
In a bag with 6 red balls and 4 blue balls, what is the probability of drawing one red ball first and then one blue ball without replacement?
Correct! 🎉 +20 pointsNot quite right
The probability of drawing a red ball first is . The probability of drawing a blue ball second is . Multiplying gives , which simplifies to .
In a bag with 6 red balls and 4 blue balls, what is the probability of drawing one red ball and one blue ball in two draws without replacement?
Correct! 🎉 +30 pointsNot quite right
There are two possible outcomes: drawing red then blue, or blue then red. Red then blue has probability . Blue then red has probability . Adding gives , which simplifies to .
Want to see the full working?
Interactive Activity
Use a tree diagram to visualise how probabilities are calculated.
Loading interactive widget...
Students Also Ask
The questions students bump into most on this topic
You multiply when you move along a path, and you add when you combine separate outcomes. Multiplying the branches gives one full outcome, such as red then red. Adding different outcomes answers questions that allow more than one result, like red or blue.
When you do not replace the first ball, fewer balls remain for the second draw. After drawing one ball from ten, only nine are left. So the second draw's probabilities use a denominator of nine, and they depend on which colour you drew first.
Add the probabilities of every outcome that includes it. For at least one blue ball, add red then blue, blue then red, and blue then blue. Alternatively, subtract the unwanted outcome from 1. The only outcome with no blue is red then red, so you work out 1 minus its probability.
Add the probabilities of all the possible outcomes. They must total 1. This is a quick way to check your work. If they do not add up to 1, you have made a mistake on one of the branches, so go back and check each probability.
Without replacement means you do not put the first item back before the second draw. So the total falls by one, and the counts change depending on what you drew first. This makes the second draw conditional, which is why its branch probabilities differ from the first draw.